
The 5 Waves of Elliott Wave Theory
- What is Elliott Wave Theory?
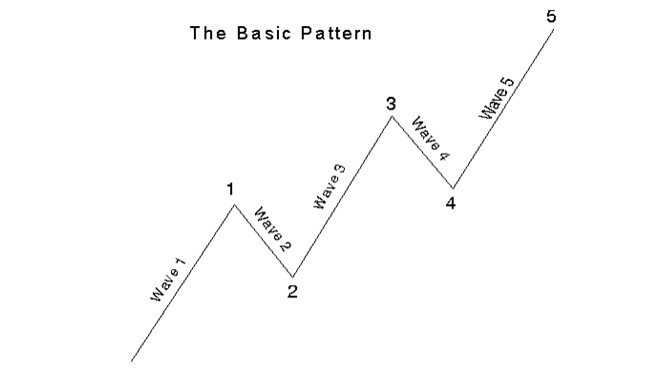
Elliott Wave Theory(EWT) is named after Ralph Nelson Elliott who proposed in 1938 that the movement of the stock market could be predicted by observing and identifying a repetitive pattern of waves.
- Wave Personality
1) Wave 1 and wave 2
Wave 1: In EWT, wave one is not obvious at its inception. When the first wave of a new bull market begins, the fundamental news is almost universally negative. The previous trend is considered still strongly in force. The economy probably does not look strong. Sentiment surveys are bearish, put options are in vogue, and implied volatility in the options market is high. Volume might increase a bit as prices rise, but not by enough to alert many technical analysts. (In this example, I used $NASDAQ 100(NDX)$)
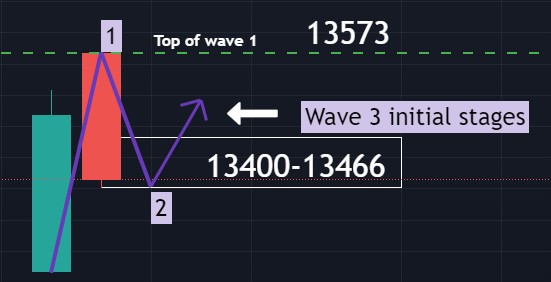
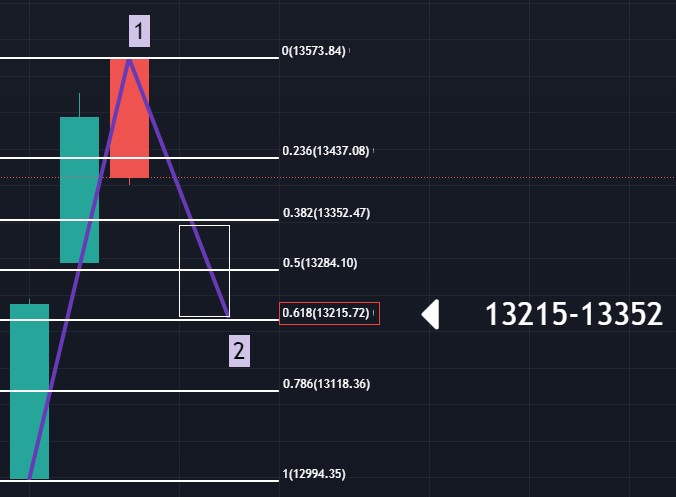
Wave 2: In EWT, wave two corrects wave one, but can NEVER extend beyond the starting point of wave one. Typically, the news is still bad. As prices retest the prior low, bearish sentiment quickly builds, and “the crowd” reminds all that the bear market is still deeply ensconced. Still, some positive signs appear for those who are looking: volume should be lower during wave two than during wave one, prices usually do not retrace more than 61.8% (see Fibonacci picture below) of the wave one gains.
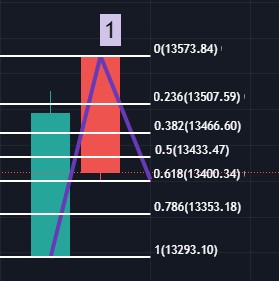
Wave 2 typically falls within the 38.2%-61.8% range (13400-13466 in this example), so we can observe if the price falls beyond 13400, which is an indication to determine if the next few predictions remain valid.[正经]
2) Wave 3
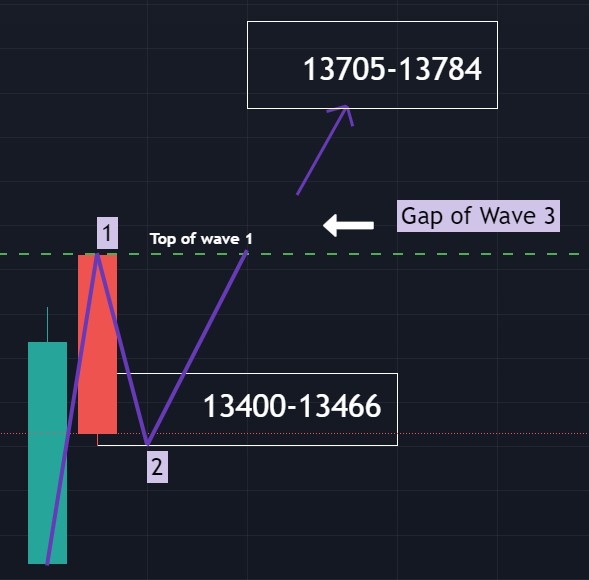
Wave 3: In EWT, wave three is usually the most powerful wave in a trend. The news is now positive. Prices rise quickly, corrections are short-lived and shallow.[财迷] As wave three starts, the news is probably still bearish, and most market players remain negative; but by wave three’s midpoint, “the crowd” will often join the new bullish trend. Wave three often extends wave one by a ratio of 1.618:1.
Wave 3 rally picks up steam and takes the top of Wave 1. As soon as the Wave 1 high is exceeded, gaps are left open. Gaps are a good indication of a Wave 3 in progress.(In this example, it is a bullish signal if there is a gap formed when Wave 3 rise above 13573)
3) Wave 4
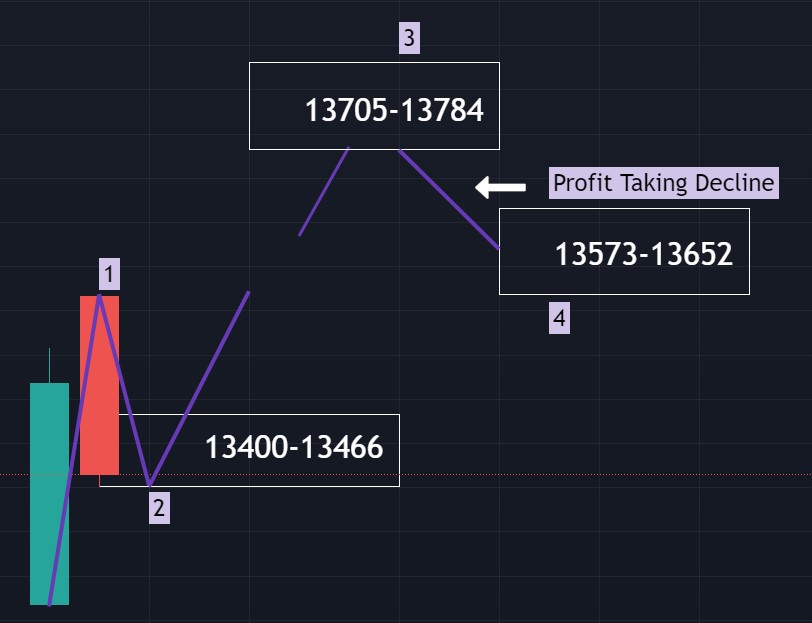
At the end of Wave 4, more buying sets in and prices start to rally again. Wave four is typically clearly corrective and retraces less than 38.2% of wave three. Volume is well below than that of wave three. This is a good place to buy a pull back if you understand the potential ahead for Wave 5. Still, fourth waves are often frustrating because of their lack of progress in the larger trend. Do keep in mind that Wave 4 can NEVER cross into the same price area as wave 1.[嘘] For example, we buy into $NASDAQ-100 Index ETF(QQQ)$ or $ProShares UltraPro QQQ(TQQQ)$ when NDX is at around 13652 to catch the Wave 5 rally, we should then set a stop-loss slightly below 13573.[龇牙]
4) Wave 5
Wave 5: In EWT, wave five is the final leg in the direction of the dominant trend. The news is almost universally positive and everyone is bullish.[看涨] Unfortunately, this is when many retail investors finally buy in, right before the top.[叹气] Volume is often lower in wave five than in wave three. At the end of a major bull market, bears may very well be ridiculed.[晕]
Wave 5 lacks huge enthusiasm and strength found in the Wave 3 rally. Wave 5 advance is caused by a small group of traders. Although the prices make a new high above the top of wave 3, the rate of power or strength inside Wave 5 advance is very small when compared to Wave 3 advance.
- What happens if the waves did not form as planned?
If so, try looking from a broader perspective. In the above example, if Wave 2 continues to fall under 13400, we can assume that Wave 1 start from a day earlier and continue to observe if it holds above 13215 instead.[可爱] If it falls beyond that, it might not be the setup we are looking for and we do not enter the trade.[吃瓜]
It might take days for the waves to form. Thus, we need to be patient and not rush into a trade. Before trading, we should take our time to decide on a trade. During a trade, we must be swift on our decisions as to when to exit the trade. With more experience, it will get easier so don't give up easily just because the first trade failed.[胜利]
- Recent Example of the 5 Waves
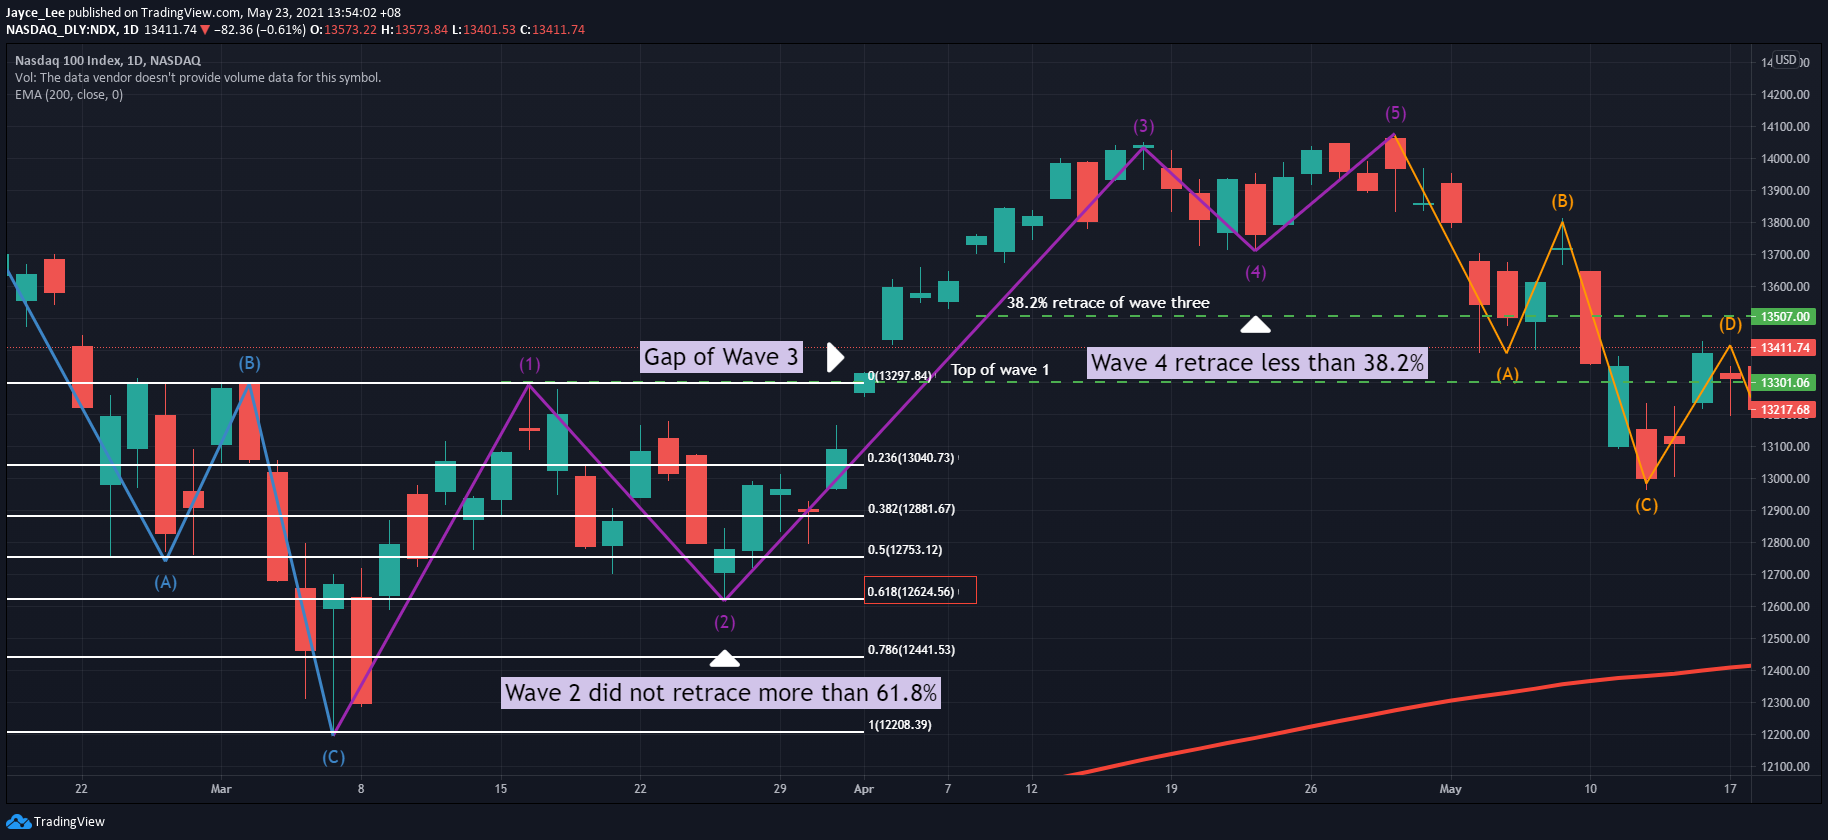
As you can see, the five waves may take many days to form and might not be very visible at first glance since they won't follow the textbook pattern perfectly. If you are unable to find the pattern, try to look from the bigger picture. Nevertheless, the waves should still primarily follow the guidelines of EWT:
- Prices usually do not retrace more than 61.8% in Wave 2
- Gaps are a good indication of a Wave 3 in progress
- Wave 4 typically retraces less than 38.2% of Wave 3
*Take note: The end of the 5 waves are usually followed by corrective waves which can be hard to identify as the fundamental news are usually still positive. Be sure not to enter trade when Wave 5 is above Wave 3 so as to not get caught at a high point when a correction occurs. [喷血]
If you've read till this point, I'm sure you are serious about trading and I wish that this information will help you in your trading journey.[保佑] Always keep in mind to plan your trade, and trade your plan![真香]
Disclaimer: The above example is for educational purposes only. I am not a financial adviser and you shouldn't trade blindly based on my advise. [暗中观察]
$NASDAQ(.IXIC)$ $Apple(AAPL)$ $NIO Inc.(NIO)$ $Roblox Corporation(RBLX)$ $Sea Ltd(SE)$ $Etsy(ETSY)$ $NVIDIA Corp(NVDA)$ $Digital Turbine(APPS)$ $Salesforce.com(CRM)$ $Snowflake(SNOW)$ $Costco(COST)$ $Li Auto(LI)$
免责声明:上述内容仅代表发帖人个人观点,不构成本平台的任何投资建议。
- IcySilver·2021-05-23Do you use multiple time frames to plot the waves?1举报
- 2461fbaf·2021-05-24中国特色社会主义制度好2举报
- JayceLee·2021-05-25Look at my next post for detailed example to apply this technical analysis. [可爱]2举报
- DFValue·2021-05-23$GameStop(GME)$ to the mooon [财迷]2举报
- Alihuat·2021-05-25wa.. i didnt know this1举报
- 实话·2021-05-24好,很好,非常好!1举报
- 一只小狮子io·2021-05-24[财迷]1举报
- sonsly01·2021-05-24[微笑]1举报
- NicholaS·2021-05-24👍1举报
- Hello8888·2021-05-26good thks1举报
- Hello8888·2021-05-26great1举报
- 河沐·2021-08-26Good1举报
- 雪无止境待梅绽开·2021-05-24C11举报
- 伊卡丝killsme·2021-05-24C21举报
- 伊卡丝killsme·2021-05-24C11举报
- 酒歌·2021-05-246965651举报
- 塔希提岛·2021-05-24A1举报
- 田岚·2021-05-24[微笑]1举报
- 三横·2021-05-24阅1举报
- 微笑的海·2021-05-24阅1举报