
3 Signs That the Stock Market could be Topping Out
Last week, the 4 major US indices had a smooth rally with low volume suggested there is lacking of supply in the upswing.
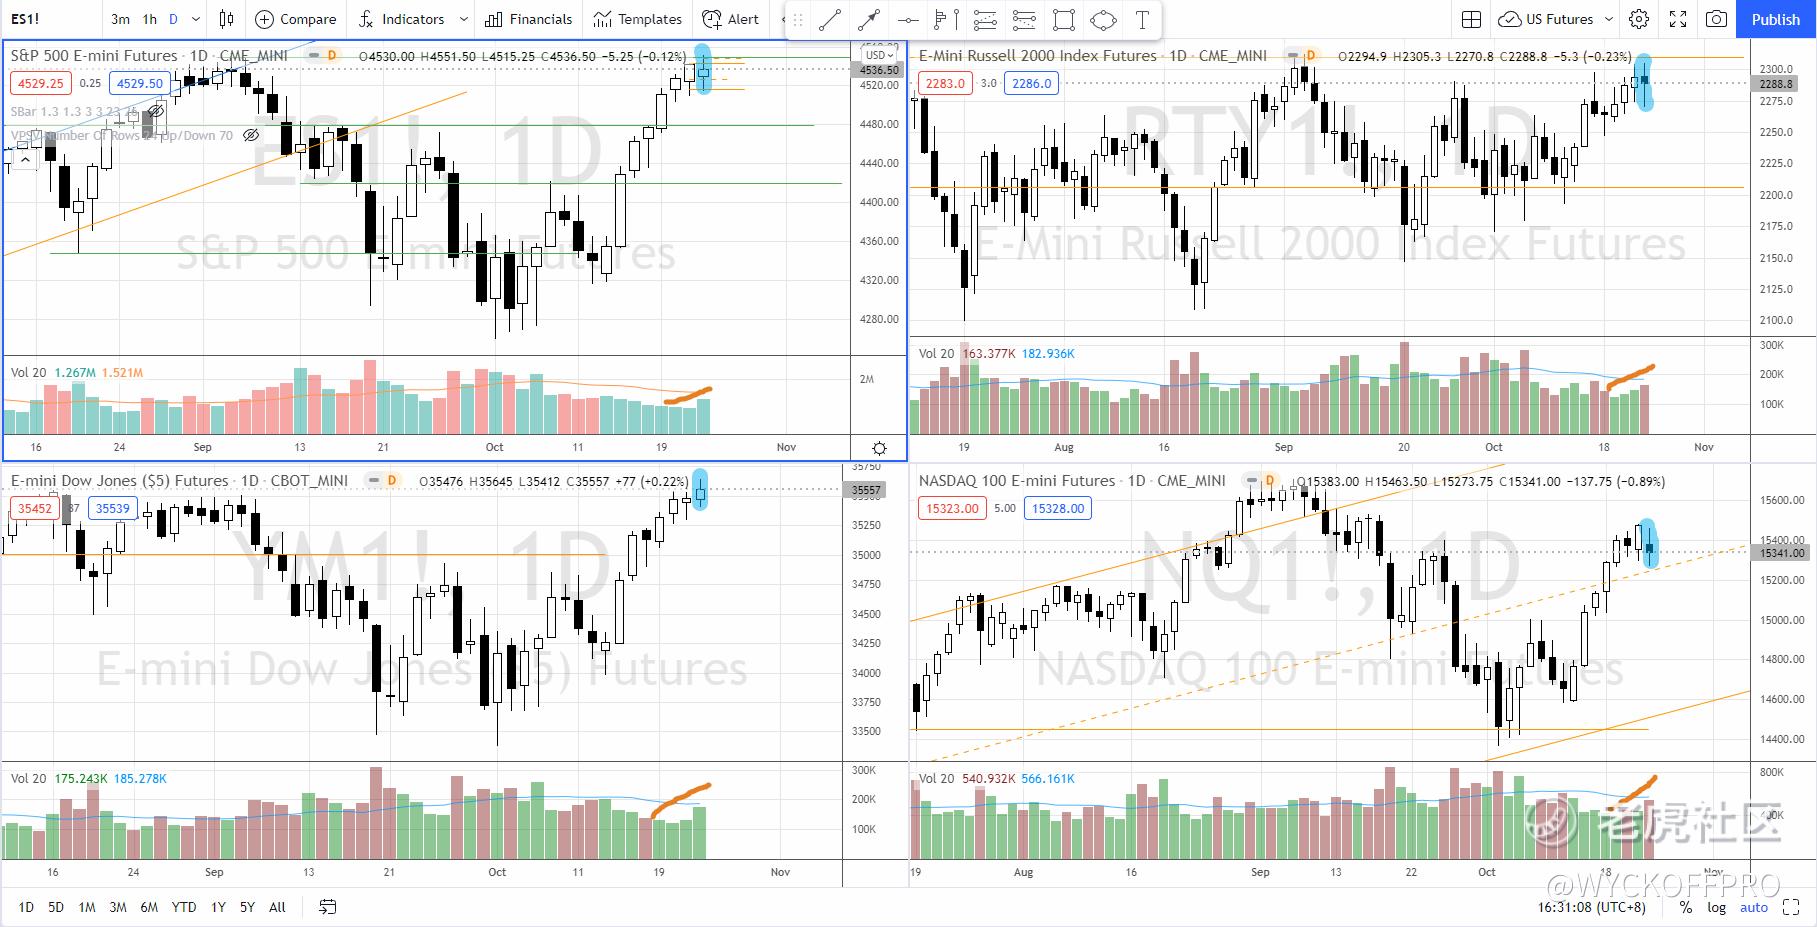
This is especially obvious in the $SP500指数主连 2112(ESmain)$ , as shown in the upper left pane above. However, one thing stands out on last Friday among the 4 US indices:
1. S&P 500 futures (ES) tested the all time high at 4550 followed by a mild rejection.
2. Dow Jones futures (YM), as shown in the lower left pane, also had a mild rejection despite closing at all time high.
3. Russell 2000 futures (RTY) failed to commit above the swing high formed on 15 Oct with mild rejection, as shown in the upper right pane.
4. Nasdaq futures (NQ) had slightly larger rejection and also failed to commit above the swing high formed on 27 Sep 2021.
Most importantly, the price rejections for the 4 indices come with increasing of volume, despite not significant yet.The bearish price action together with the increasing volume suggested presence of supply, while happening at the key levels (which are the various resistance for the indices).
The Signs
These are the 3 things one should look for to spot a potential market top because this is the full context of interpreting what’s happening in the market.
- Price action: Bearish or bullish, which is the result.
- Volume: the effort behind the price movement. By reading together with the price, we will be able to interpret which force (supply or demand) is dominating, based on Wyckoff’s law — Efforts vs Results.
- Context: in this case, this price rejection happened at the key levels (all time high, resistance, etc…)
What’s Next
Based on the above, my directional bias for the market is to the downside. However, I am still waiting for a change of character bar for confirmation and timing. By calling a market top doesn’t mean it will crash from here on. It could be just a normal pullback after an extensive run up.
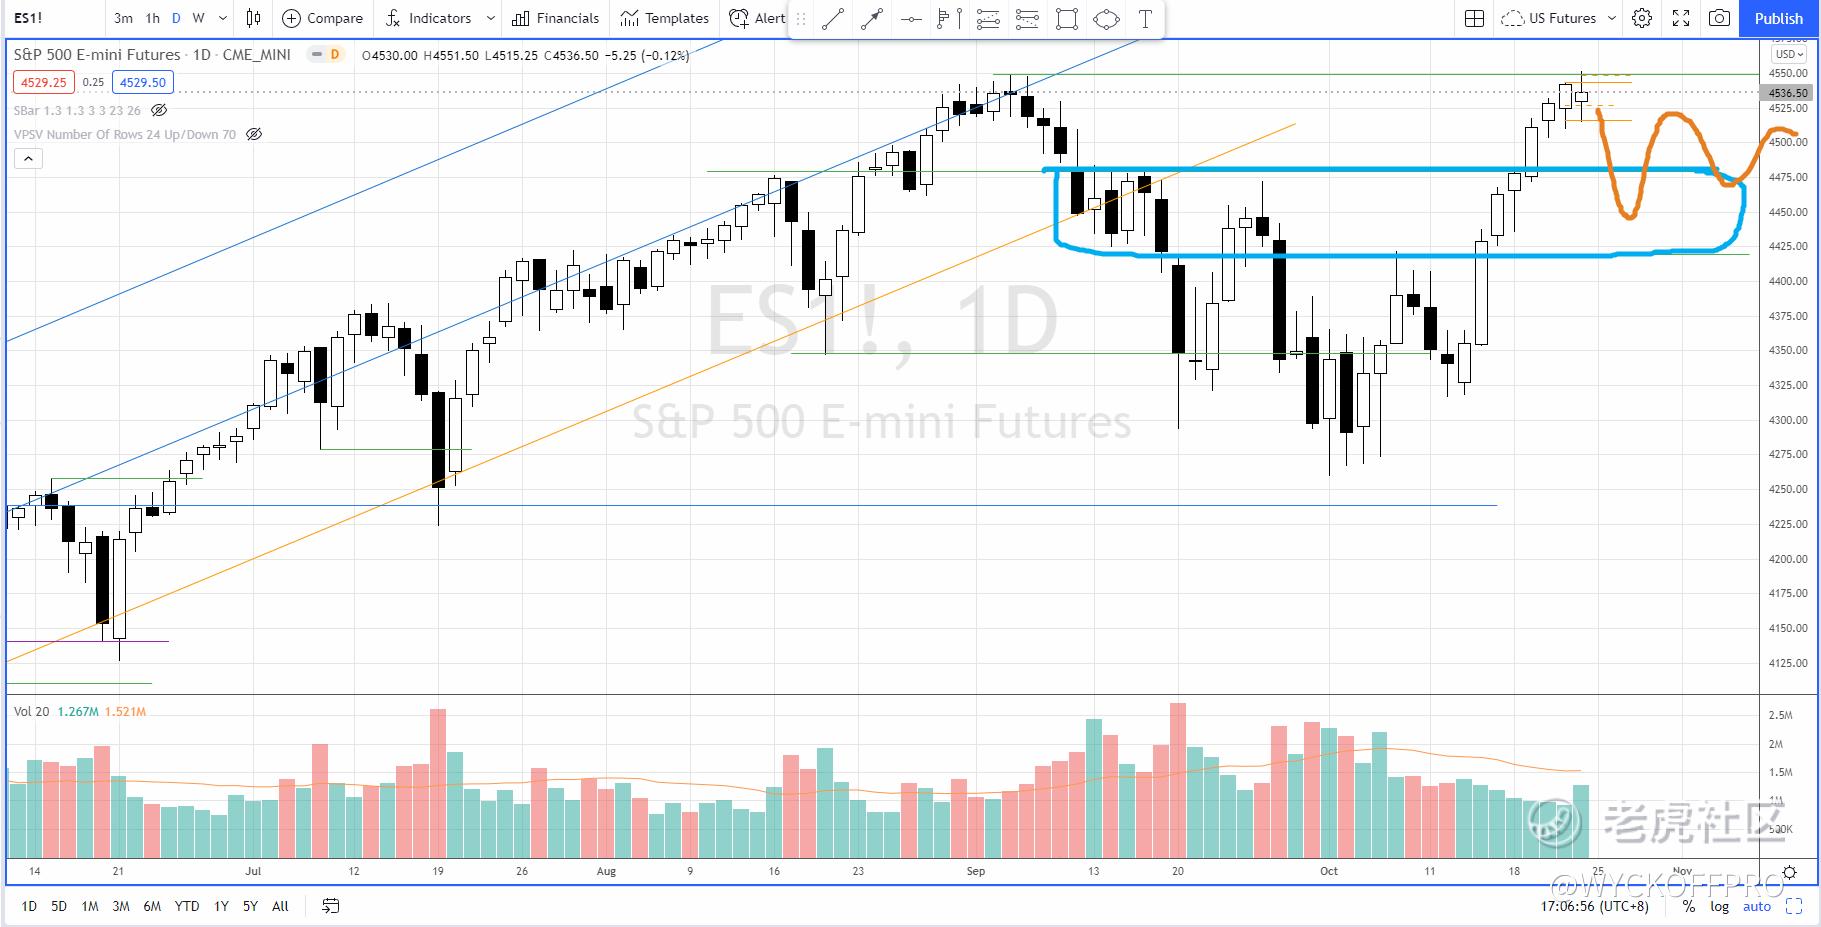
Using S&P 500 as a case study, the immediate support area is at 4420–4480, as boxed up in blue with the possible travel annotated in orange, as shown in the chart above. This could be the most bullish scenario for S&P 500 should it reverse from the top near 4550.
If the support area 4420–4480 fails to hold, it is likely to go back to test the swing low near 4300, with a potential prolong trading range going into next year.
Nonetheless, should indices pullback in the coming week(s), it is the best time to monitor the stocks (that beat the market), which will be the next outperformers when the tide turns.
Safe trading. If you are day trading the US futures or swing trading for Malaysia and US stocks, do check out my YouTube Channel: Ming Jong Tey for additional videos and resources. $阿里巴巴(BABA)$ $苹果(AAPL)$ $迪士尼(DIS)$ $特斯拉(TSLA)$ @Tiger Stars
Further Reading
Trading Earnings Announcements the Smart Way.
These 3 Stocks Flash Out Buy Signals During Market Correction
免责声明:上述内容仅代表发帖人个人观点,不构成本平台的任何投资建议。

学习