
A Bargain you can't Ignore — This Laggard Breaks All Time High & Outperforms Nasdaq Last Week
Last week, Russell 2000 $罗素2000指数主连 2112(RTYmain)$ gained 6% (top right as highlighted in yellow) and was the best performer among the 4 major US indices, followed by Nasdaq 100 $NQ100指数主连 2112(NQmain)$ (bottom right), S&P 500 $SP500指数主连 2112(ESmain)$ (top left) and Dow Jones $道琼斯指数主连 2112(YMmain)$ (bottom left), as shown in the weekly chart below:
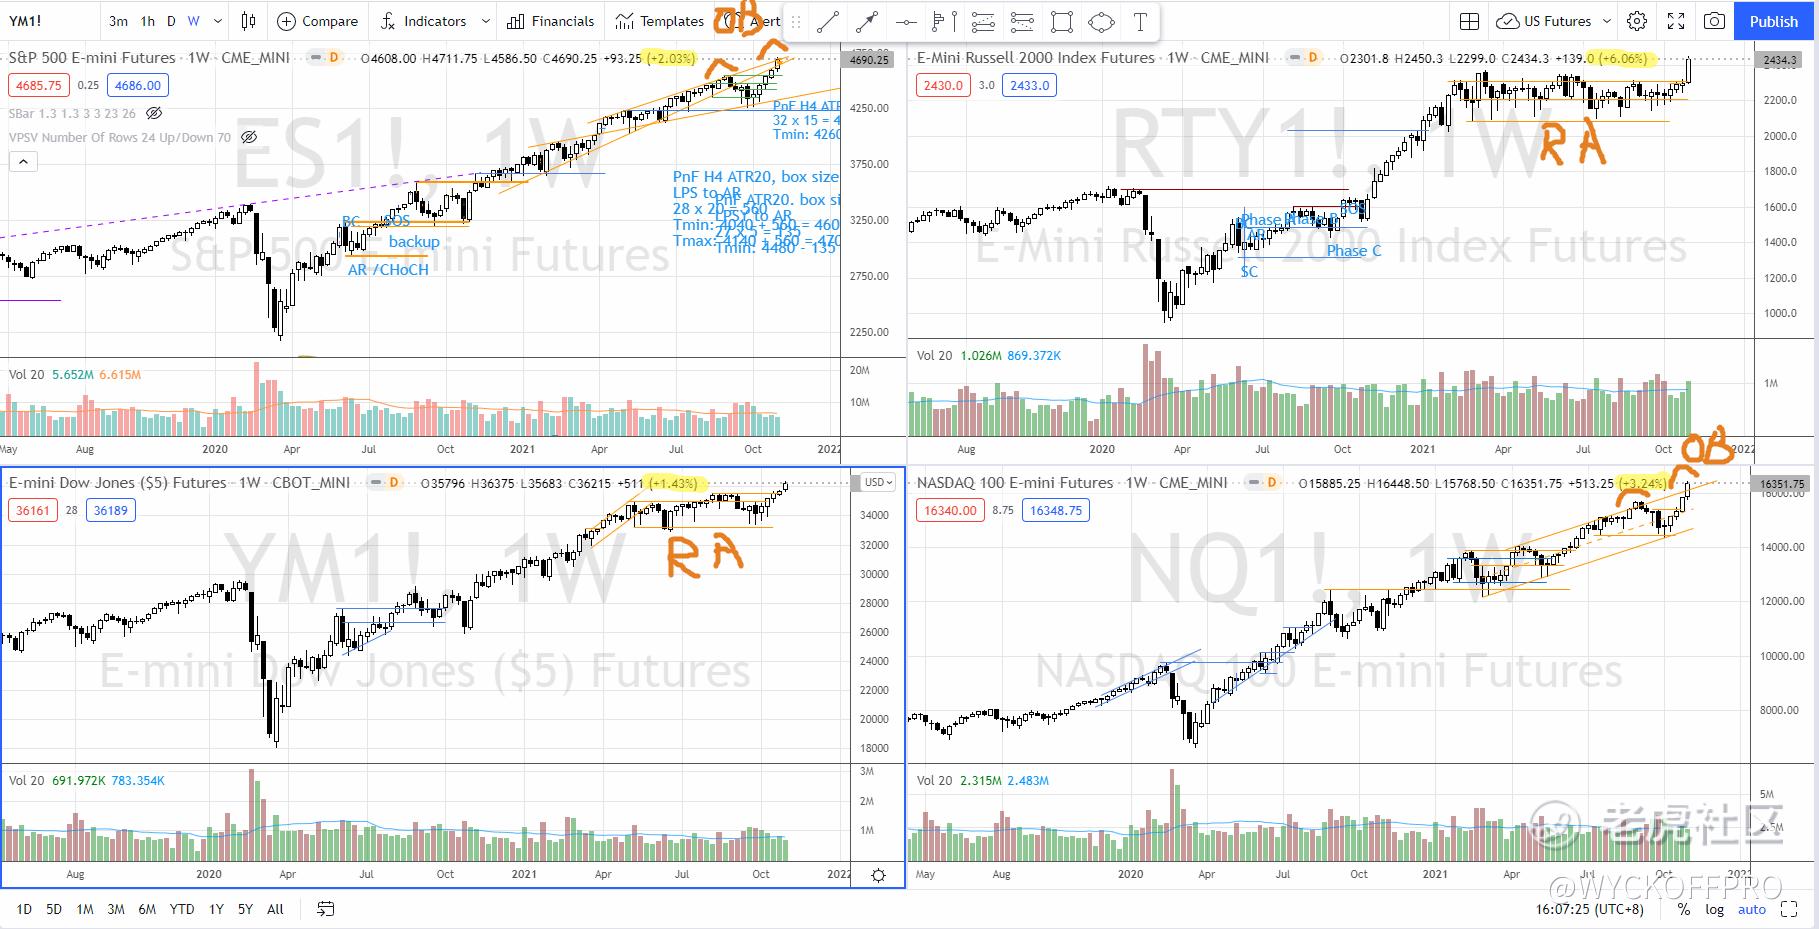
Both Russell 2000 and Dow Jones just broke out from the re-accumulation structure while S&P 500 and Nasdaq travels within a well define up channel and currently hit the channel’s overbought line. Would we see a rotation from the S&P 500 and Nasdaq to the Russell and the Dow Jones?
I have emphasized Russell 2000 many times in the following posts since earlier Sep 2021:
- The two proxies to confirm the super bull run
- Market is going down — beginning of selloff or rotation?
- The Next Biggest Index/ETF Winner
- One chart reveals how rising interest rate affects your investment
- Will The Rising Interest Rate Crash the Stock Market
Let’s focus on the daily chart of the Russell 2000 index futures (RTY) as shown below:
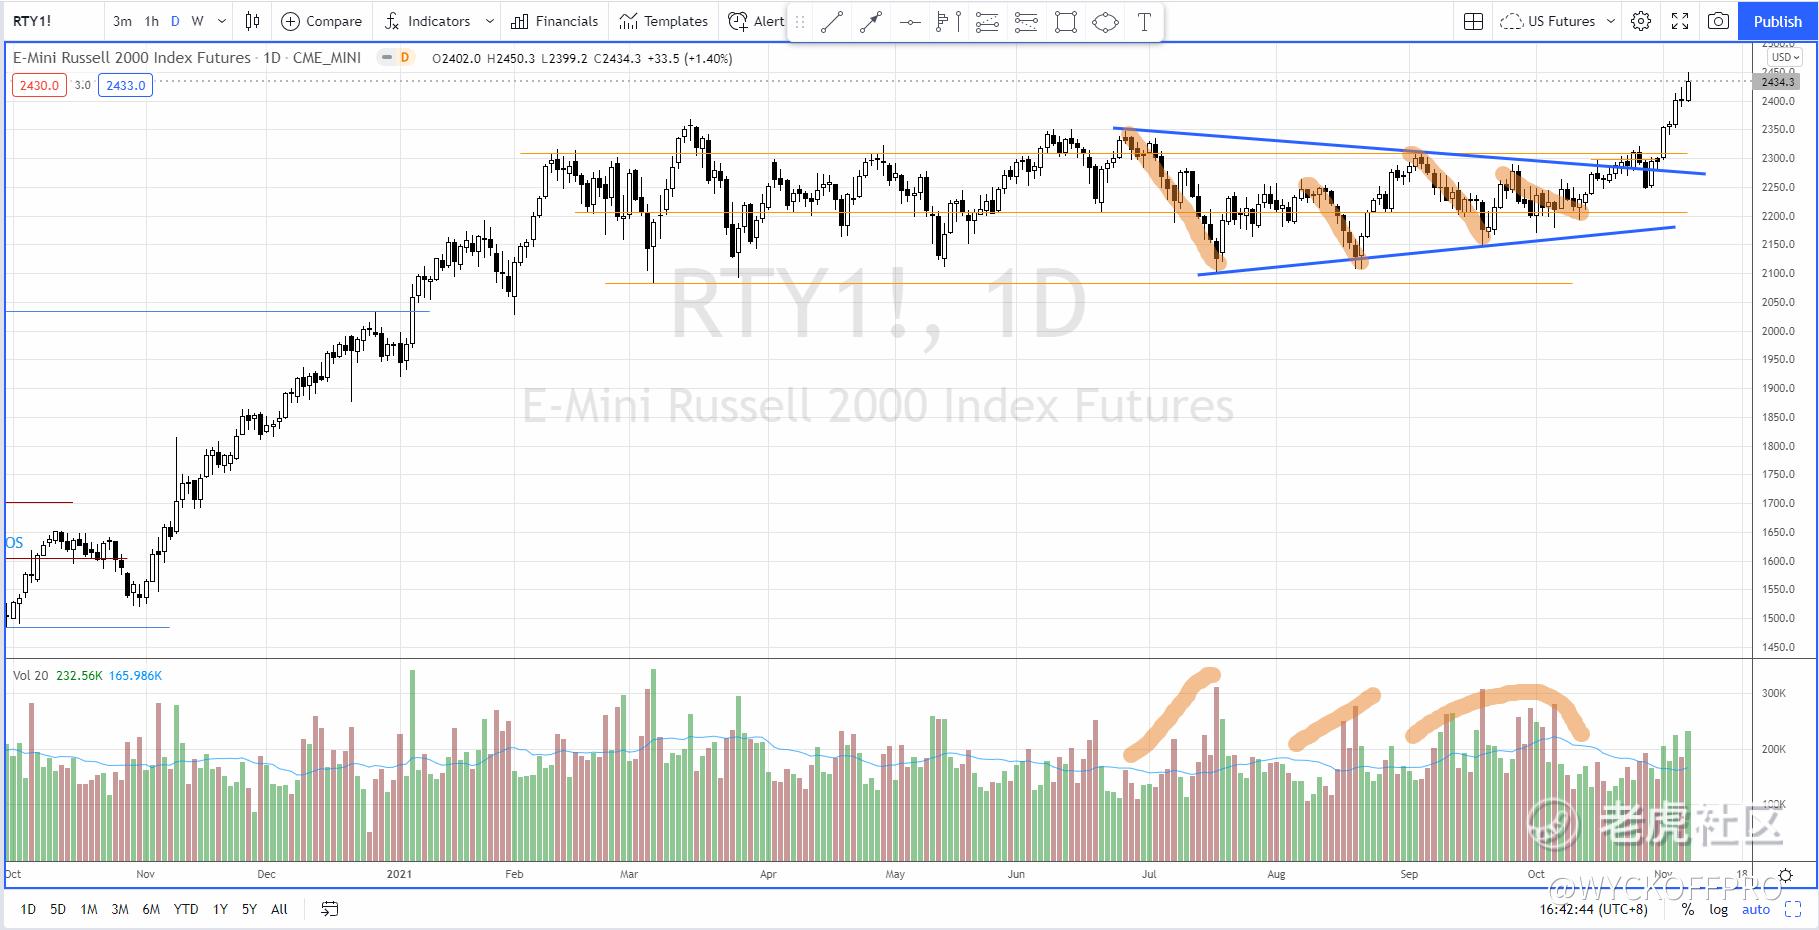
An apex formation has formed since July 2021 and there is something unusual about this triangle pattern. Normally, while the price is consolidating within the triangle (forming lower high and higher low), we will notice decreasing of the volume together with the contraction of the volatility (e.g. the price spread of the candles are getting smaller from left to right hand side of the triangle).
In this case, despite the volatility is getting lower, the volume is expanding on every down wave, suggesting lots of selling. Yet, what’s the results? A higher low throughout from Aug till Nov 2021. This suggests that there was supply absorption going on while the selling happened.
This is very constructive for a bullish scenario because the “strong hands” step in to support the price on every reaction and to scoop up the bargain.
At the end of Oct 2021, there is an attempt to breakout of both the triangle and the horizontal resistance at 2310 followed by a shallow pullback and reversal, which marks the last point of support (LPS) of the accumulation structure before the sign of strength rally breaks above the structure. The supply level is especially low from the previous reaction suggests that the absorption is completed and ready to markup.
As heavy supply has been absorbed within the triangle pattern, we might not expect a backup action coming back to test the axis line where the resistance-turned-support around 2310–2370, instead the backup action could happen at higher ground.
The breakout of the Russell 2000 gives the first confirmation of the scenario of possible rotation from big cap stocks to small cap stocks.
A Quick Guide to Get Exposure to Small-Caps
The easiest way to participate the small caps without worrying about stock picking is via the ETFs. Feel free check out iShares Russell 2000 ETF ($罗素2000指数ETF(IWM)$ ), Russell 2000 Growth ETF (IWO), Russell 2000 Value (IWN), S&P 600 Small Cap ETF (SLY), S&P 600 Small Cap Value (SLYV), S&P 600 Small Cap Growth (SLYG).
If you want to take it to the next level to beat the ETF, just explore the individual stocks within the those ETFs and pick those that outperform the market, sector and group with accumulation structure and wait for the right trade setup that suits you.
Safe trading. If you are day trading the US futures or swing trading for Malaysia and US stocks, do check out my YouTube Channel: Ming Jong Tey for additional videos and resources. @Tiger Stars
Further Reading
The Most Important Trading and Investing Rule You Need to Know
免责声明:上述内容仅代表发帖人个人观点,不构成本平台的任何投资建议。
- JayceLee·2021-11-10Recently I've been studying Wyckoff accumulation and distribution. Love your analysis using this methodology. [强]2举报
- PageDickens·2021-11-08Buying ETF is indeed one of the most labor-saving investment methods. I also buy ETFs when I am busy and have no time to study stocks. However, it didn't bring me a good return. Its change was similar to the average return of the market.1举报
- MurrayBulwer·2021-11-08Your analysis is very clear and logical. It is very helpful for me to invest! But I'd like to know how you judge the time point and amplitude? For example, when can each fluctuation turn?1举报
- BlithePullan·2021-11-08what do you think the curve would be like in this week? i personally believe the index would rebound 😁1举报
- MariaEvelina·2021-11-09😊😊Although I think your conclusion can be referred to, I really don't agree with your analysis method. I prefer to build a model, so let me calculate and simulate before drawing a conclusion.🤣🤣1举报
- FabianGracie·2021-11-09What you said is great, but it would be nice if you could be more specific. Could you present a case study? That will give us a better understanding.🤔1举报
- BartonBecky·2021-11-09What you said is really very specific. Thank you for providing me with new investment ideas. Good luck to you.点赞举报
- BonnieHoyle·2021-11-09So what should I do? I have been buying stocks in NASDAQ, and I know too little else. Can you share more?1举报