On Thursday evening, Benzinga asked followers on Twitter, Instagram and Facebook to post a reply to a short trivia question along with the ticker of their favorite stock. We then selected the ticker of one follower who answered correctly and analyzed the stock’s chart.
The trivia question was: How much Doge does Mark Cuban own? Twitter user @AndyBriski answered correctly with $494, and requested Tesla Motors for technical analysis.
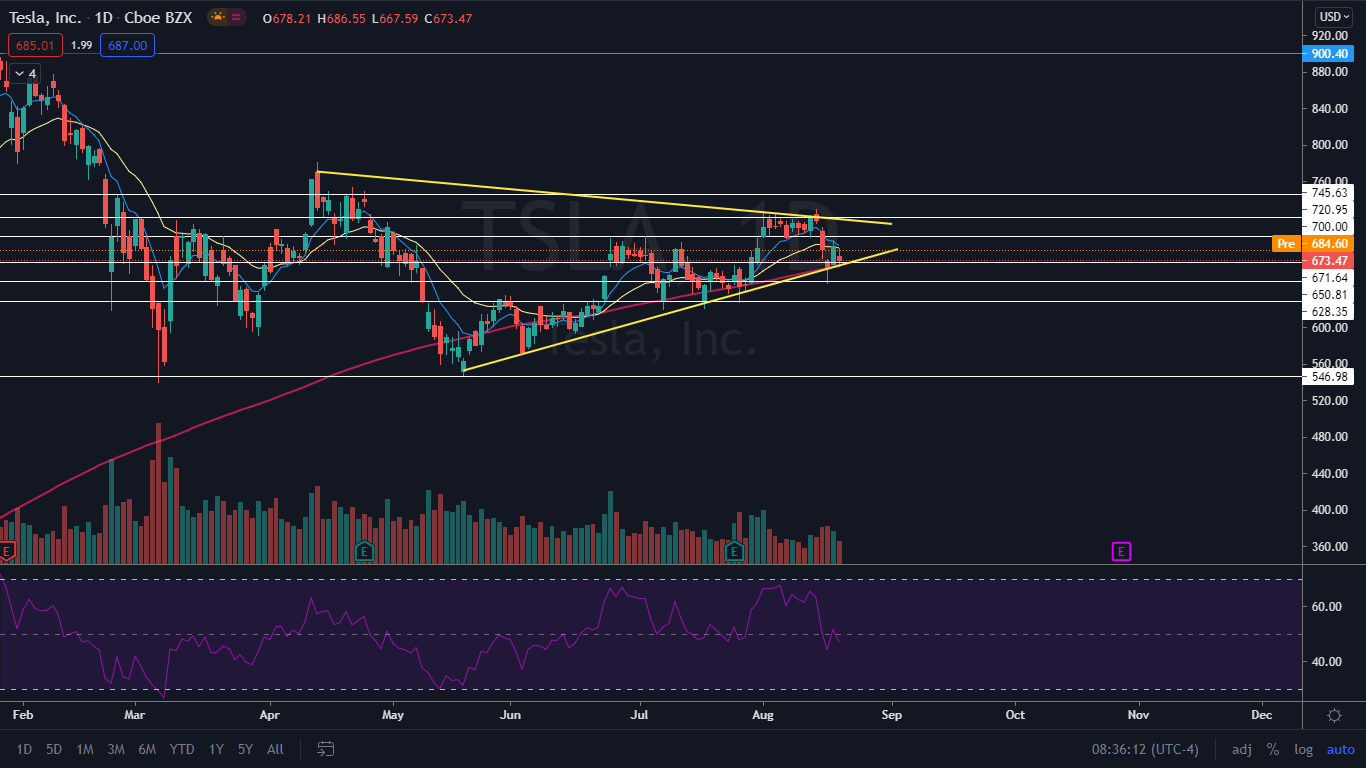
The Tesla Chart: Tesla’s stock has been trading in a fairly consistent uptrend since May 19 when it hit a low of $546.98 and bounced. The stock has also formed into a triangle pattern and on the past three trading days Tesla’s stock has tested the bottom ascending trendline of the pattern and support and held above it. The top descending line of the pattern began on April 14 and Tesla’s stock has tested it as resistance on nine separate occasions and failed to break up from it.
A triangle pattern is neither bullish nor bearish and traders can watch for the break up or breakdown from the pattern to take a position. The measured move of a break from a triangle pattern is the distance between the highest and lowest price at the beginning of the pattern. This indicates Tesla’s stock could rise or fall $217 when it breaks from the pattern.
Tesla closed Thursday down slightly lower but on lower-than-average daily volume which indicates consolidation. The stock has a relative strength index of about 47% which is comfortable for both the bulls and the bears.
Tesla is trading slightly below the eight-day and 21-day exponential moving averages (EMA), which is short-term bearish. The eight-day EMA is trending above the 21-day, however, which is a good sign for the bulls. Tesla will need to regain support of both the moving averages in the near future to avoid the eight-day crossing below the 21-day EMA.
The stock is trading above the 200-day simple moving average (SMA), which indicates overall sentiment in the stock is bullish. The 200-day currently aligns with the ascending trendline of the triangle which gives it extra support.
- Bulls want to see big bullish volume come in and drive Tesla’s stock up over resistance at $700 and toward the upper trendline of the triangle. If Tesla can break up above the triangle, it has resistance above at $720 and $745.
- Bears want Tesla to break down from the triangle and lose support of the 200-day SMA on big bearish volume to feel confident the move isn’t a trap. Below the triangle Tesla’s stock has support at $650 and $628.