(深度|期权老司机必读)——Sell Vol 的收益以及风险(一)
The Risks and Rewards of Selling Volatility
卖波动率期权策略的盈利以及风险
Federal Reserve Bank of Atlanta
ECONOMIC REVIEW First Quarter 2001 31
BUYING AND SELLING CERTAIN KINDS OF VOLATILITY-SENSITIVE OPTIONS PORTFOLIOS IS A POPULAR PRACTICE EVEN THOUGH THIS ACTIVITY IS ASSOCIATED WITH SUBSTANTIAL RISK.
买入和卖出某些对波动率高度敏感的期权组合在业界非常普遍,即使卖出波动率这类策略伴随着巨大的潜在市场风险。
WHEN SUCH PORTFOLIOS ARE FORMED, TWO FACTORS SIGNIFICANTLY INFLUENCE THE VALUE OF THE OPTIONS: THE PRICE OF THE UNDERLYING ASSET AND THE FUTURE VOLATILITY EXPECTED TO prevail until the options expire. It is possible to form a portfolio of call and put options so that the portfolio’s payoff is very sensitive to the volatility of the underlying asset but only minimally sensitive to changes in the level of the underlying asset. Traders and investors who frequently buy or sell such portfolios do so with a view of the volatility of the underlying asset that does not correspond to the expected future volatility embedded in the option price, or the implied volatility.1 For example, the former hedge fund Long Term Capital Management had created portfolios of options on certain stock indexes based on its view that expected future volatility was different from the prevailing implied volatilities (Dunbar 1999).
当这些投资组合形成时,两个因素会显着影响期权的价值:在期权到期之前,预期资产的价格和未来的波动性将占上风。可以形成看涨期权和看跌期权组合,使得投资组合的收益对标的资产的波动性非常敏感,但对标的资产水平的变化只有最低限度的敏感性。经常购买或出售此类投资组合的交易者和投资者这样做是为了考虑相关资产的波动性,这与期权价格中隐含的预期未来波动率或隐含波动率不相符.1例如,前对冲基金LTCM长期资本管理公司根据其预期未来波动率与现行隐含波动率不同的观点,创建了某些股票指数的期权组合(Dunbar 1999)。
There is often a substantial risk, however, in options portfolios set up to exploit perceived mispricing in the expected volatility of the underlying an asset without initial sensitivity to the level of the asset. This risk stems from possible subsequent abrupt changes in the level of the asset price. Changes in volatilities are highly negatively correlated with changes in levels in many asset markets. If a short position in implied volatility on a market is created and a subsequent sharp market decline results in much higher implied volatility, the value of the implicit short position in volatility could dramatically decrease. For example, the former Barings PLC sustained huge losses from short positions in volatility (initiated by a trader, Nick Leeson) on Nikkei futures as the Nikkei plunged in early 1995 (Jorion 2000). The objective of this article is to delineate the risks and rewards associated with the popular practice of selling volatility by selling a particular portfolio of options called straddles. Toward this end, the article first examines the statistical properties of the returns generated by selling straddles on the Standard and Poor’s (S&P) 500 index. Although it is theoretically possible to construct other options portfolios to make volatility bets (Carr and Madan 1998), straddles are by far the most popular type of portfolio.
然而,在期权组合中通常存在很大的风险,这些风险投资组合旨在利用对基础资产的预期波动性的错误定价,而不会对资产水平产生初步敏感性。这种风险源于资产价格水平随后可能发生的突然变化。波动率的变化与许多资产市场的水平变化高度负相关。如果创建市场隐含波动率的空头头寸并且随后的市场急剧下跌导致隐含波动率高得多,则波动率中隐含空头头寸的价值可能会急剧下降。例如,由于日经指数在1995年初暴跌(Jorion 2000),前Barings PLC因日经指数波动(由交易员Nick Leeson发起)对日经指数期货的空头头寸造成巨大损失。本文的目的是通过出售一种称为跨界的特定投资组合来描述与卖出波动性的流行做法相关的风险和回报。为此,本文首先考察了标准普尔(S&P)500指数抛售产生的回报的统计特性。虽然理论上可以构建其他期权投资组合以进行波动性投注(Carr和Madan 1998),但跨式策略是迄今为止最受欢迎的投资组合类型。
The article also demonstrates that the usual practice of selling volatility by comparing the observed implied volatility (from option prices) with the volatility expected to prevail (given the history of asset prices) could be flawed. This flaw could arise if the underlying asset has a positive risk premium—that is, if its expected return over a given horizon exceeds the risk-free rate over the
该文还表明,通过比较观察到的隐含波动率(来自期权价格)与预期普遍存在的波动率(鉴于资产价格的历史)来推销波动率的通常做法可能存在缺陷。如果相关资产具有正的风险溢价 - 即,如果其在给定范围内的预期收益超过无风险利率,则可能出现此缺陷。
SAIKAT NANDI AND DANIEL WAGGONER Nandi is a former senior economist at the Atlanta Fed and is currently a financial engineer at Fannie Mae. Waggoner is an economist in the Atlanta Fed’s research department. They thank Jerry Dwyer and Larry Wall for helpful comments.
First Quarter 2001 same horizon—and the returns of the underlying asset is negatively correlated with changes in volatility. Thus, basing the decision to sell a straddle on a comparison of seemingly irrational high implied volatilities with much lower expected volatility could itself be an irrational choice.
2001年第一季度同一时期 - 相关资产的回报与波动率的变化呈负相关。因此,基于对看似无理性的高隐含波动率与低预期波动率的比较来卖出跨越的决定本身可能是一种非理性的选择。
Straddles
跨式期权策略
A straddle might seem to be an ideal vehicle through which to express a view on the future volatility of the underlying asset without necessarily having an initial view on the future direction of the asset price.
跨式可能似乎是一种理想的工具,通过该工具可以表达对相关资产未来波动性的看法,而无需初步了解资产价格的未来方向。
Straddles are very popular but quite volatility sensitive options portfolios. A straddle consists of a call and put option of the same strike price and maturity so that the strike price is equal to (or very close to) the current price of the underlying asset. The higher the volatility until the option expires, the higher the expected profits from buying the straddle, and vice versa.
跨式策略非常受欢迎,但作为对波动性非常敏感的期权组合。跨式包含相同执行价格和到期日的看涨期权和看跌期权,以使执行价格等于(或非常接近)相关资产的当前价格。在期权到期之前波动率越高,买入跨式策略的预期利润越高,反之亦然。
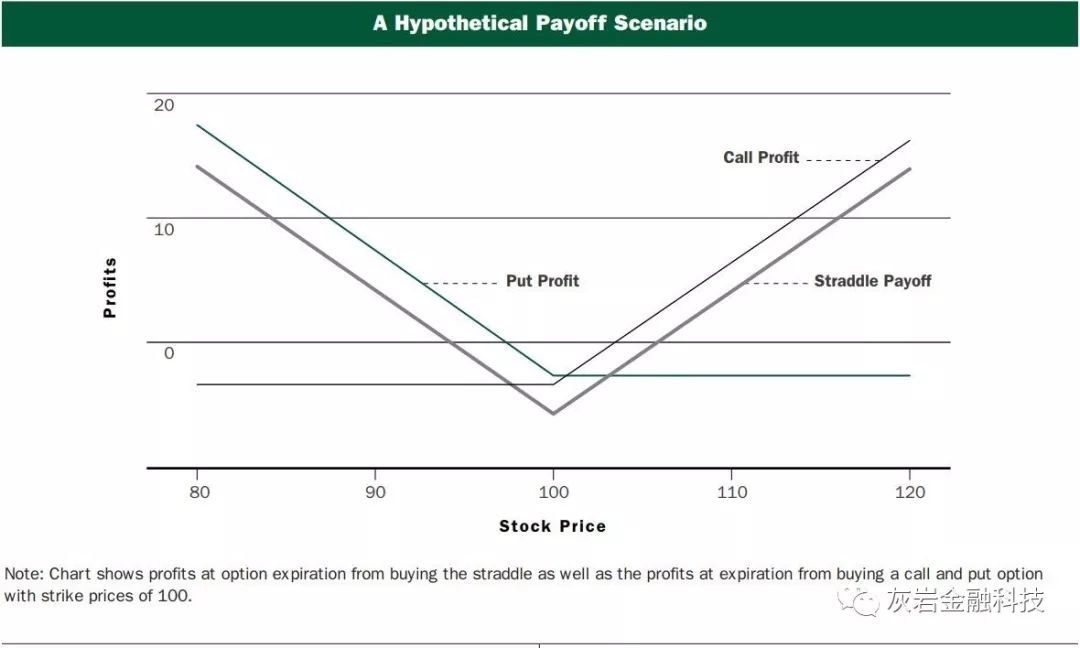
For example, suppose an investor buys a European straddle that matures in fifty days, the current price of the underlying stock is $100, and the strike prices of both the European call and put options are $100.
例如,假设一个投资者购买了一个在五十天内到期的欧洲跨国,底层股票的当前价格是100美元,而欧洲看涨期权和看跌期权的执行价格都是100美元。
Under the (BSM) Black-ScholesMerton model (outlined in Black and Scholes 1973 and Merton 1973) with an annualized implied volatility of 20 percent and a risk-free rate of 5 percent, the price of the call option is $3.29, and the put option price is $2.61. The cost of the straddle is thus $5.90 ($3.29 + $2.61).
根据(BSM)Black-ScholesMerton模型(Black and Scholes 1973和Merton 1973概述),年化隐含波动率为20%,无风险利率为5%,看涨期权的价格为3.29美元,看跌期权 期权价格为2.61美元。因此,跨骑的成本为5.90美元(3.29美元+ 2.61美元)。
If the stock price at the expiration of the option is at least $105.90 (payoff from the call option is $5.90, and payoff from the put option is zero) or $94.10 (payoff from the put option is $5.90, and payoff from the call option is zero), the buyer breaks even. The greater the stock price is than $105.90 or the lower it is then $94.10, the greater the buyer’s profits are.
如果期权到期时的股票价格至少为105.90美元(看涨期权的收益为5.90美元,看跌期权的收益为零)或94.10美元(看跌期权的收益为5.90美元,并且来自看涨期权的收益是 零),买家收支平衡。股票价格高于105.90美元或者低于94.10美元,买方的利润越大。
Conversely, if the stock price is greater than $94.10 but less than $105.90, the seller of the straddle turns in a profit because the revenue generated by the sales exceeds the losses when the straddle expires. Of course, the narrower the dispersion of the possible stock prices at maturity, the higher the seller’s profits.
相反,如果股票价格高于94.10美元但低于105.90美元,那么跨式策略的卖方会盈利,因为销售产生的收入超过跨骑到期时的损失。当然,到期时可能的股票价格的分散越窄,卖方的利润就越高。
The chart shows the payoff from buying the straddle when the options expire.When the straddle is created, the change in its value is not very sensitive to the change in the value of the underlying asset. The previous example and the chart clearly show, however, that the higher the volatility of the underlying asset between the present time and option expiration, the higher the potential payoff from a long position in the straddle. A straddle might thus seem to be an ideal vehicle through which to express a view on the future volatility of the underlying asset without necessarily having an initial view on the future direction of the asset price—that is, a trader might buy a straddle if volatility is expected to be high or sell one if volatility is expected to be low.
该图表显示了期权到期时买入跨式的收益。当创建跨式策略时,其价值的变化对标的资产价值的变化不是非常敏感。 然而,前面的例子和图表清楚地表明,当前时间和期权到期之间相关资产的波动性越高,跨式策略中多头头寸的潜在收益就越高。因此,跨式可能似乎是一种理想的工具,通过该工具可以表达对相关资产未来波动性的看法,而无需对资产价格的未来方向进行初步观察 - 即,如果波动性,交易者可能会买入跨行 如果预计波动性较低,预计会很高或卖出一个。
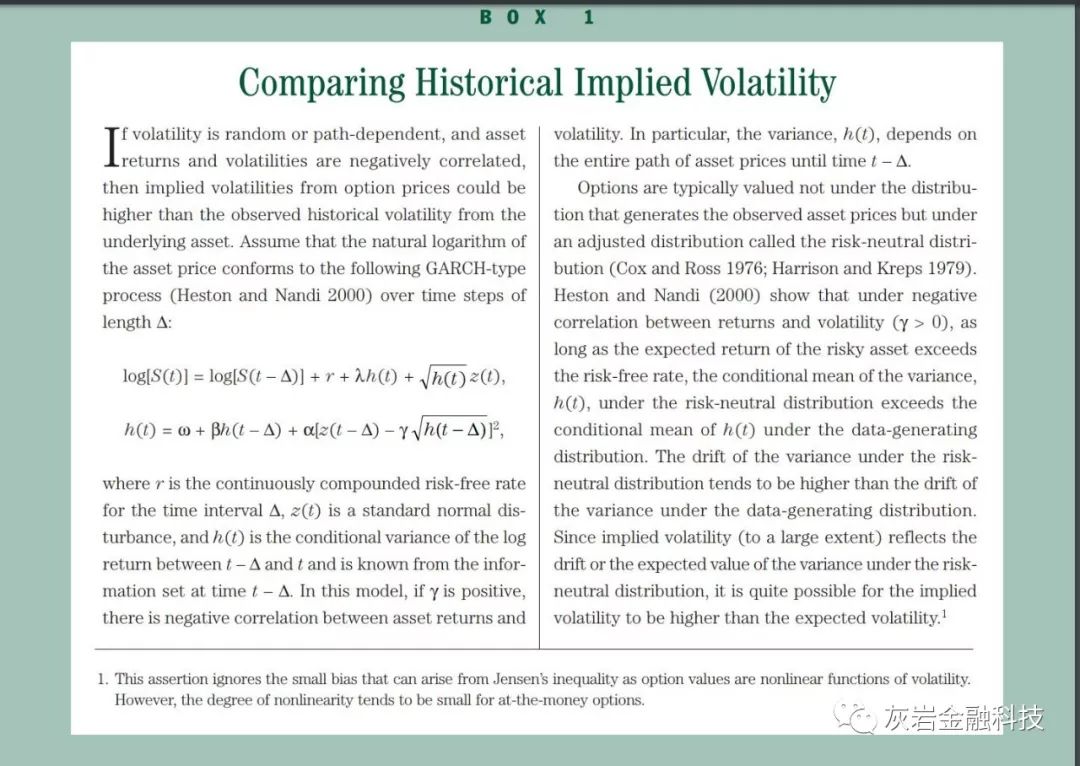
To see how a straddle is a bet on volatility, assume that the implied volatility (using the BSM model) from a straddle on an equity option that expires in one month is 40 percent (annualized). On the other hand, assume that the maximum historical volatility of the underlying asset that has been observed over any one-month horizon is 30 percent (annualized). Based on this observation, would one sell the straddle—in other words, sell volatility— because it appears to be high? If volatility is constant or evolves deterministically, that is, if the assumptions of the BSM model hold true, it may be tempting to sell the straddle. It has been well documented, however, that in most asset markets volatility evolves randomly through time (Bollerslev, Chou, and Kroner 1992). Even if volatility were constant or predictable, the price of the underlying asset could periodically undergo an abrupt level shift—sometimes referred to as a jump in the price process.2 Because of these factors, a risk premium related to the randomness of volatility or unpredictable jumps in asset prices could get incorporated into the price of an option (Bates 1996). The implied volatility determined from the price of an option using the BSM model would thus be contaminated with the relevant risk premium, making any comparison with historical volatility problematic.3Box 1 gives an example in which the volatility of the underlying asset evolves randomly and the changes in volatility and returns are negatively correlated. The box shows that as long as the underlying asset has a positive risk premium, the implied volatility from the options could be higher than a historical measure of volatility. Because the BSM model may be an inadequate description of the observed option prices, caution is warranted in using it to compare implied volatility to historical volatility.
为了了解跨式策略是如何押注波动性,假设跨越一个月到期的股票期权的跨式波动率(使用BSM模型)为40%(年化)。另一方面,假设在任何一个月的范围内观察到的相关资产的最大历史波动率为30%(年化)。根据这一观察结果,人们会卖出跨式 - 换言之,卖出波动性 - 因为它看起来很高?如果波动率是恒定的或确定性地发展,也就是说,如果BSM模型的假设成立,则可能很有可能卖出跨式策略。然而,有充分证据表明,在大多数资产市场中,波动性随着时间的推移而随机演变(Bollerslev,Chou和Kroner 1992)。即使波动性是恒定的或可预测的,相关资产的价格也可能会周期性地发生突变 - 有时也称为价格过程的跳跃.2由于这些因素,与波动性随机性或不可预测性相关的风险溢价资产价格的跳跃可能会被纳入期权的价格(Bates 1996)。因此,使用BSM模型的期权价格确定的隐含波动率将受到相关风险溢价的影响,使得与历史波动率的任何比较成为问题.3框1给出了一个示例,其中标的资产的波动性随机演变并且变化波动性和收益率呈负相关。该框显示,只要标的资产具有正风险溢价,期权的隐含波动率可能高于历史波动率指标。由于BSM模型可能对观察到的期权价格的描述不充分,因此在使用它来隐含波动率与历史波动率进行比较时需谨慎。
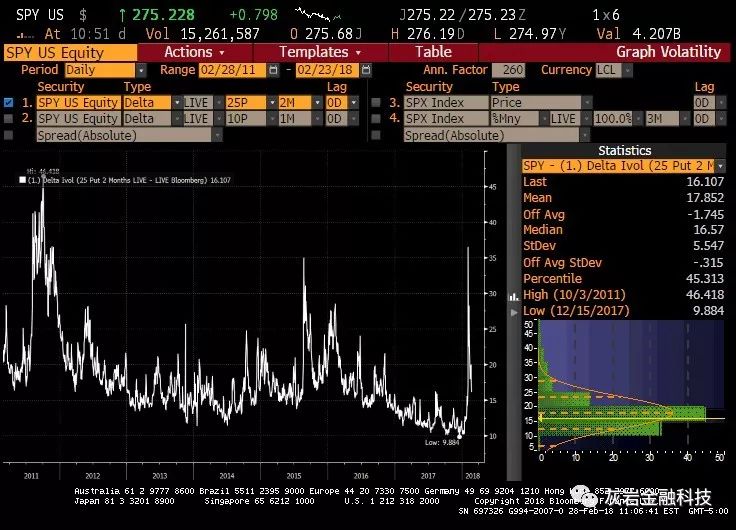
The Implied and Historical Volatility of the S&P 500
标普500的隐含波动率以及历史波动率
In trading straddles on a market index such as the S&P 500, it is important to have a good understanding of the dynamics of volatility through time. This section offers a computation of the implied volatilities from near-the-money options (options in which the strike price is as close as possible to the price of the underlying asset) on the S&P 500 and a simple but frequently used measure of historical volatility for each trading day over a six-year horizon, 1990 through 1995.4 On each day, historical volatility is computed as the standard deviation from a sample of the last thirty days of daily S&P 500 returns (close-to-close) and then multiplied by the square root of 252 (as there are about 252 trading days in a year with daily returns assumed to be independently and identically distributed).
在标准普尔500指数等市场指数交易中,重要的是要及时了解波动率的动态。本节提供了对标准普尔500指数中近期期权(工资价格尽可能接近标的资产价格的期权)的隐含波动率的计算,以及一个简单但经常使用的历史波动率度量 对于六年期间的每个交易日,1990年至1995年.4每天,历史波动率计算为每日标准普尔500指数收益(接近收盘)过去30天样本的标准差,然后乘以 252的平方根(因为一年中约有252个交易日,假设每日收益独立且相同地分配)。
The means and standard deviations of the annualized implied volatilities and the annualized historical volatilities are shown in Table 1. This table demonstrates that the implied volatility from near the-money S&P 500 index options tends to be above (on average, 3 percent) the measure of historical volatility frequently used in practice.5 In addition, the minimum and maximum historical volatilities observed over this period tend to be lower than the minimum and maximum implied volatilities. Someone comparing the implied volatility with the simple measure of historical volatility might often be tempted to sell straddles. Box 1 shows, however, that implied volatilities can be above historical volatilities without any trading opportunities.
年化隐含波动率和年化历史波动率的均值和标准差见表1.此表显示近期货币标准普尔500指数期权的隐含波动率往往高于(平均3%)该指标 在实践中经常使用的历史波动率.5此外,在此期间观察到的最小和最大历史波动率往往低于最小和最大隐含波动率。有人将隐含波动率与历史波动率的简单衡量结果进行比较,这可能往往是出售跨界的诱因。然而,专栏1显示,隐含波动率可能高于历史波动率而没有任何交易机会。
The Impact of Correlation and Implied Volatility Skew
相关性以及隐含波动率倾斜的冲击
Although it is possible to sell straddles based on an incorrect comparison of volatilities, the larger risk from selling straddles often arises from the correlation between returns and volatility as well as large changes in asset price over a short period. In many equity markets, returns and volatility tend to be negatively correlated—volatility goes up if returns go down, and vice versa. From 1990 to 1995, the average correlation between daily returns on the S&P 500 and the daily changes in implied volatilities was –0.525. For example, on August 23, 1990, as the S&P 500 closed at 307.06, down from its previous overnight close of 316.55, the implied volatility from short-maturity straddles (seven to forty days in expiration) went up to 0.322 from the previous day’s 0.265.6 Similarly, on August 27, 1990, as the S&P 500 closed at 321.44, up from its overnight close of 311.31, the implied volatility from the straddles went down to 0.239 from previous day’s 0.307.
尽管基于不正确的波动率比较可以卖出跨式,但卖出跨式的较大风险通常来自回报和波动率之间的相关性以及短期内资产价格的大幅变化。在许多股票市场中,收益率和波动率往往呈负相关 - 如果收益率下降,波动率会上升,反之亦然。从1990年到1995年,标准普尔500指数的日收益与隐含波动率的每日变化之间的平均相关系数为-0.525。例如,在1990年8月23日,由于标准普尔500指数收于307.06,低于之前的隔夜收盘价316.55,短期成熟因素(到期时间为7至40天)的隐含波动率从前一天上升至0.322。0.265.6同样,1990年8月27日,由于标准普尔500指数收盘于321.44,高于隔夜收盘311.31,因此横盘的隐含波动率从前一天的0.307下跌至0.239。
If a trader sells volatility through straddles and the market goes down, the value of the short position in the straddles drops considerably, more than the loss incurred on a long position in the market. For example, if a trader had sold a straddle on the S&P 500 index at the beginning of the day on November 11, 1991, and held it through the day as the market went down around 3.6 percent, the action would have incurred a loss of around 9 percent on the straddle position over the day. At the same time, sharp upswings in the asset price could also adversely impact the value of a straddle. As the S&P 500 increased from 343.95 to 356.95 from January 31, 1991, to February 7, 1991, the return from selling straddles on January 31 and closing out on February 7, was –12.2 percent. Another feature of implied volatilities that could adversely impact the seller of the straddle if the price of the underlying asset goes up is the so-called skew or smirk in implied volatilities. It is well known that the S&P 500 index options market consistently exhibits a skew in implied volatilities—the lower the strike price of an option, the higher the implied volatility, and vice versa (Rubinstein 1994; Nandi and Waggoner 2000). If the S&P 500 rises sharply, the near-the-money call option of the straddle becomes an in-the-money call (the strike is less than the price of the underlying asset). The loss in the value of the short-call position thus would stem not only from the change in the level of the S&P 500 but also perhaps from the skew in implied volatilities because an in-the-money call has a higher implied volatility than a near-the-money call.
如果交易者通过跨式策略卖出波动并且市场下跌,则交叉盘中空头头寸的价值大幅下跌,超过市场多头头寸所带来的损失。例如,如果交易者在1991年11月11日当天早些时候卖掉了标准普尔500指数的跨度,并且在市场下跌3.6%左右的时候一直持有,那么该行动将会导致白天跨式位置约9%。与此同时,资产价格的大幅上涨也可能对跨式价值产生不利影响。随着标准普尔500指数从1991年1月31日至1991年2月7日从343.95上升至356.95,1月31日卖出并于2月7日收盘时的回报率为-12.2%。如果相关资产的价格上涨,隐含波动率的另一个特征可能会对跨国卖方造成不利影响,即所谓的隐含波动率的偏斜或波动率微笑。众所周知,标准普尔500指数期权市场一直表现出隐含波动率的偏差 - 期权的执行价格越低,隐含波动率越高,反之亦然(Rubinstein 1994; Nandi and Wagoner 2000)。如果标准普尔500指数大幅上涨,跨境的近期看涨期权变成了价内看涨期权(罢工低于相关资产的价格)。因此,短期看涨头寸的价值损失不仅会受到标准普尔500指数水平的变化影响,也可能源于隐含波动率的偏差,因为价内看涨期权的隐含波动率高于价内实值认购期权。
1. Because a very high implied volatility (currently observed from a near-the-money option) is likely to revert to a much lower level over a period of time—a phenomenon known as mean reversion in volatility—selling option portfolios to take advantage of this mean reversion may seem appealing.
2. The stock market crash of 1987 could be viewed as a jump in the price process of an asset.
3. Even if the payoff from the option can be perfectly replicated by trading in the underlying asset and the risk-free asset, as in the BSM model (that is, the option is a redundant security), a risk premium that is related to the riskiness of the underlying asset would still show up in the option values and therefore in the implied volatilities as long as volatility is path-dependent (Heston and Nandi 2000).
4. Options on the S&P 500 are traded at the Chicago Board Options Exchange. The description of the data from which these implied volatilities are computed appears in Box 2.
5. However, if a measure of historical volatility were computed using a model that permits the volatility to be time-varying and unpredictable, it would not necessarily lie below the implied volatility.
1.因为非常高的隐含波动率(目前从近期货币期权中观察到)可能会在一段时间内恢复到更低水平 - 这种现象被称为波动性 - 卖出期权组合中的均值回归以利用这种均值回归似乎很有吸引力。
2. 1987年的股市崩盘可能被视为资产价格过程的一次跳跃。
3.即使通过交易标的资产和无风险资产完全复制期权的收益,如BSM模型(即期权是冗余证券),风险溢价与只要波动率与路径有关,相关资产的风险仍将显示在期权价值中,因此也会显示在隐含波动率中(Heston和Nandi,2000)。
4.标准普尔500指数的期权在芝加哥期权交易所交易。表2中列出了计算这些隐含波动率的数据的描述。
5.然而,如果使用允许波动率具有时变性和不可预测性的模型计算历史波动率的度量,则其不一定低于隐含波动率。
$二倍做多VIX波动率指数短期期权ETN(TVIX)$
免责声明:上述内容仅代表发帖人个人观点,不构成本平台的任何投资建议。
- 施道中·2019-07-27看起来高大上,其实一堆屁话点赞举报
- 纯天然绿色学渣·2019-07-26好久没见楼主文章点赞举报
- hzyhlq·2019-07-27[开心]点赞举报