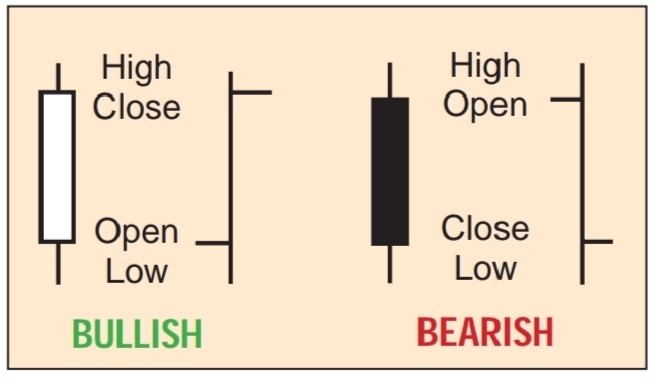
Candlesticks vs. Bar Charts
Candlestick charting point out that any patterns occurring in bar charts (cup with handle, head and shoulder, triangle, and so forth) are also identifiable in candlestick charts. The reverse is also true:
Any pattern that can be identified in candlestick charts can be seen in bar charts.
However, traditional technical analysis references do not illustrate nor explain candlestick patterns, although they go into great detail on bar pattern analysis.
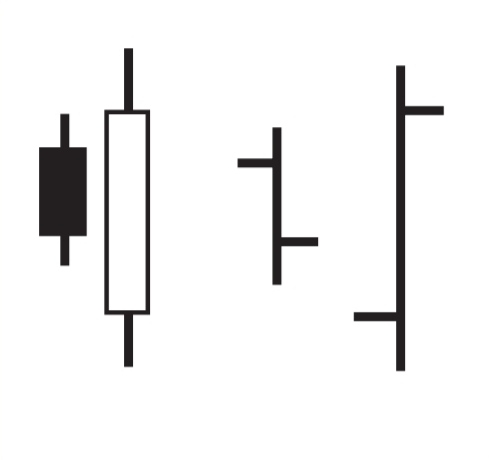
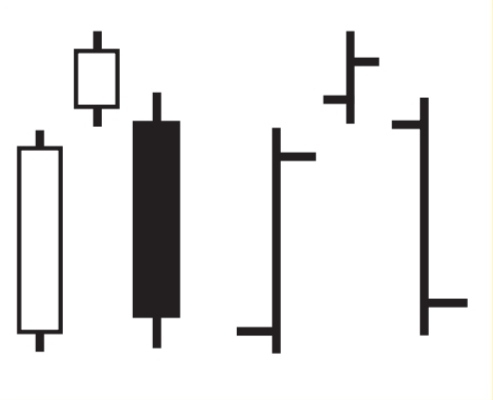
BULLISH - ENGULFING PATTERN
At first glance it may look like an outside day, but that is misleading. In a bar chart outside day, the range of the second day exceeds the range of the first day. In the candle pattern, only the range of the open/close is relevant. This is a very bullish pattern and often needs no confirmation. It follows a downtrend and signifies the beginning of a reversal.
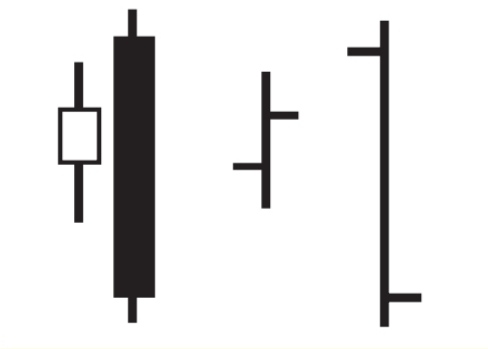
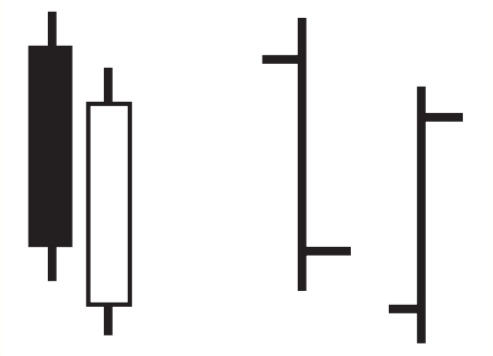
BEARISH - ENGULFING PATTERN
This is the bearish counterpart of the bullish engulfing pattern. Occurring in an uptrend, it forecasts a bearish reversal.
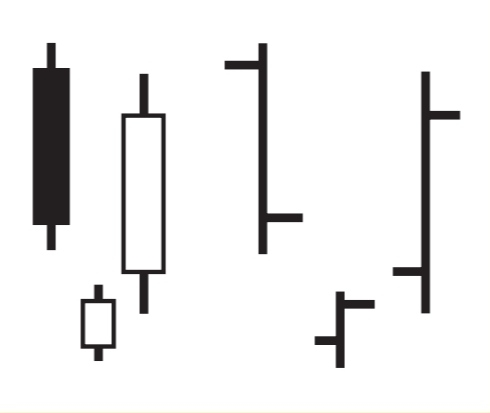
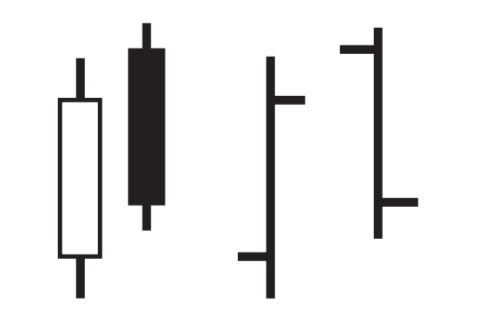
BULLISH - MORNING STAR
This is another bullish reversal pattern. Following a downtrend, the star (second day) indicates a potential bottom; therefore, a bullish reversal. If the star is a doji (see below), this becomes a more significant pattern. The third-day open bar confirms the reversal. A gap before and after the star is a more bullish pattern.
BEARISH - EVENING STAR
This is the bearish counterpart of the morning star. Following an uptrend, it forecasts a bearish reversal. The same comment applies if the second day is a doji and if there are gaps.
BULLISH - PIERCING LINE
Another bullish reversal pattern. The second day opens lower than the previous day's low but closes above the midpoint of the previous day's open/close range. This is one of the few patterns that uses the high/low range rather than the close/open range.
BEARISH - DARK CLOUD COVER
This is the bearish counterpart of the piercing line. The second day opens above the previous day's high but closes below the midpoint of the previous day's open/close range. This pattern also uses the high/ low range.
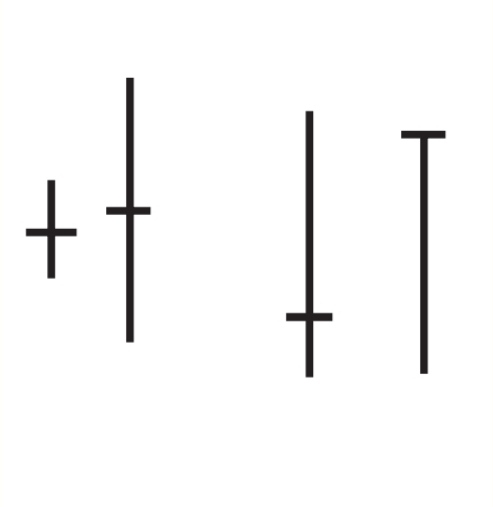
DOJI
This pattern is the same in both systems. It denotes indecision — a possible turning point. The stock opens, then may have a wide or narrow range above or below the open, then closes at the open price. It can, therefore, be bullish or bearish, depending on whether it occurs in an uptrend (bearish) or a downtrend (bullish). A double doji (two adjacent dojis) implies a very forceful breakout following the indecision.
Example
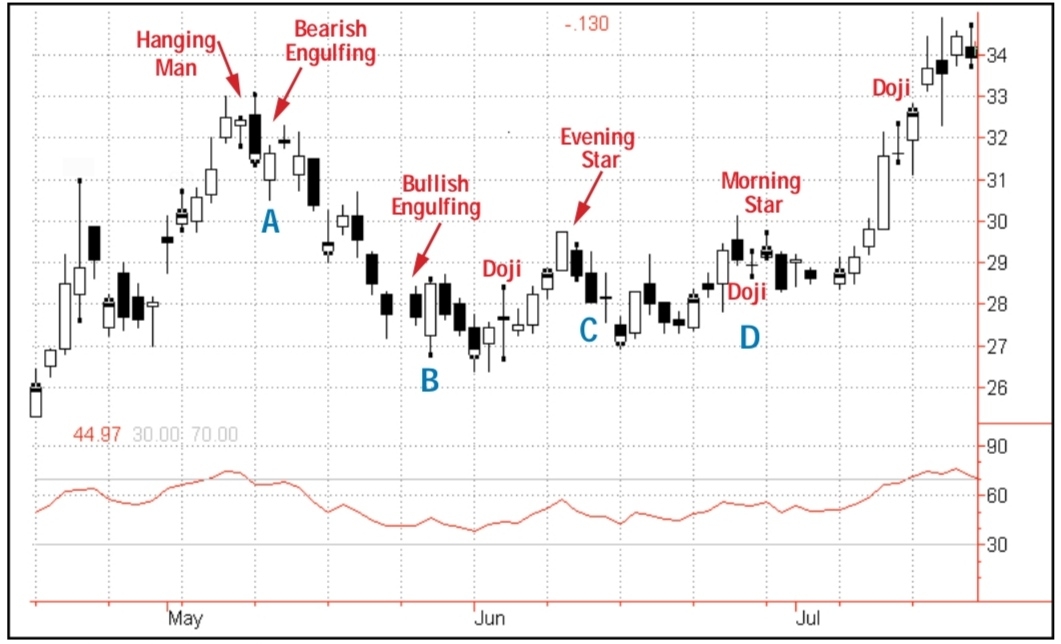
Candlestick chart with the patterns identified.
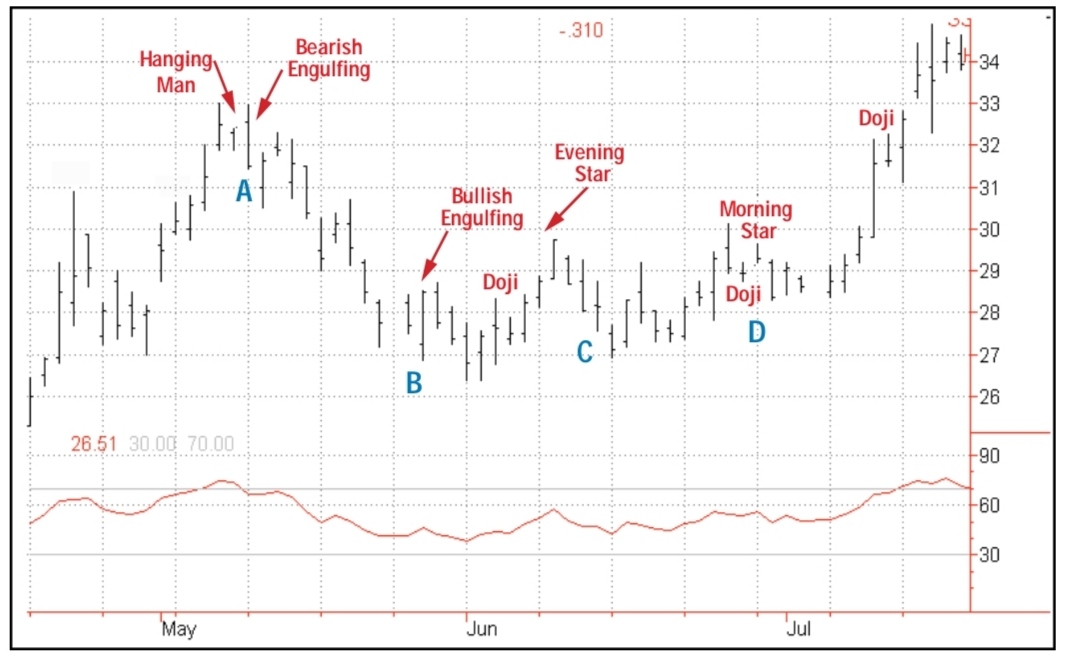
It is the same chart, but with bars replacing the candlesticks.
Point A, a bearish engulfing pattern emerges immediately after a hanging man, which is another bearish reversal. A minor downturn follows. At point B, a bullish engulfing pattern signals a possible upturn, which then occurs. Shortly into the upturn we find an evening star at point C, which is followed by a downturn. The next pattern, at point D, is a morning star where the star is a doji and, as expected, another upturn is soon under way.
免责声明:上述内容仅代表发帖人个人观点,不构成本平台的任何投资建议。
- 互联网第N代·2021-10-05这个知识点的讲解含金量很高。比我之前买的书里面介绍的简单易懂。书里面讲的太难懂,这个很通俗。1举报
- 罗杰斯之王·2021-10-05十分感谢您把各种形态的蜡烛图逐一做了分析,并且结合实际给出了案例。您的这份教程值得反复学习。1举报
- 纯天然绿色学渣·2021-10-05不知道可不可以再发一份中文的分享呢,这样可以让更多的人看到1举报
- 东营天地人和·2021-10-05受教了,这种大师级的分享帖,希望多来几次啊1举报
- 河东荷西·2021-10-05每次看这种纯技术的分享,都有不同的收货1举报
- 大米饭00·2021-10-05希望真的能够止跌回升吧1举报