

Judge the Crude Oil Direction By Its Own Action Without Reading the News

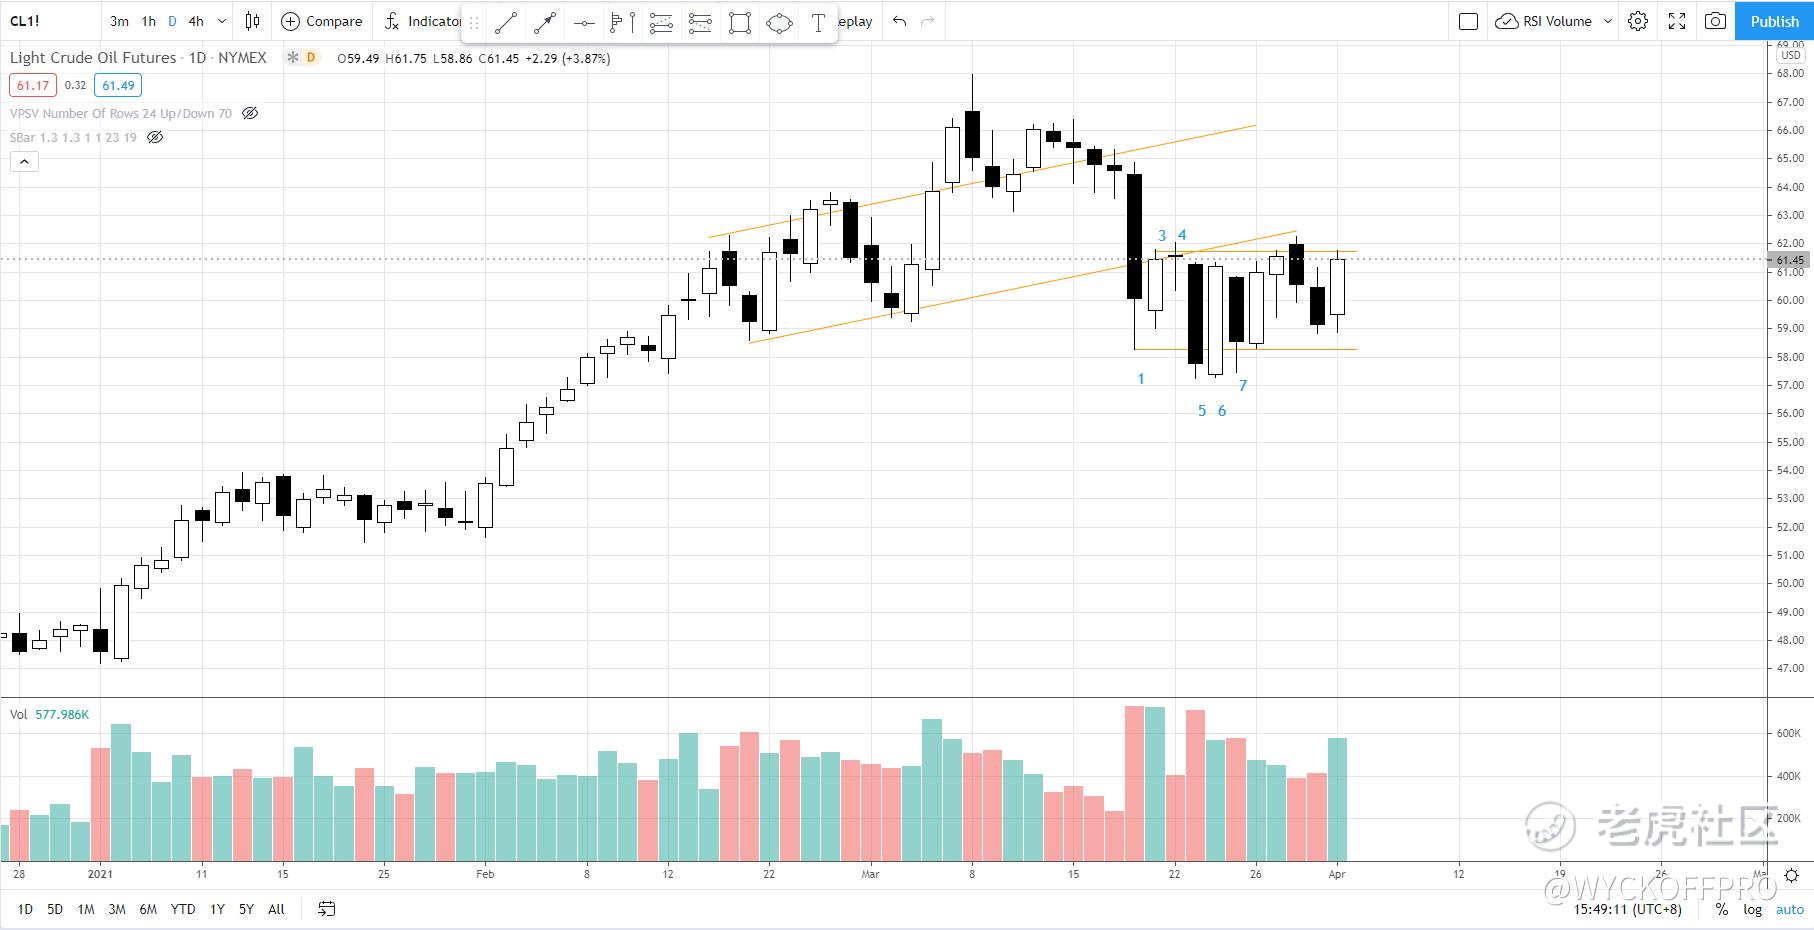
$WTI原油主连(CLmain)$ had a reaction from its peak at 68 all the way to 58 after 3 pushes up with the last push with climatic run up and spike of volume.
Accumulation or re-distribution for the trading range between 58-62?
- 18 Mar 2021: A selling climax was formed with spike of the volume
- Spike of the volume = increase of both supply and demand, in this case, the supply overwhelmed the demand hence the bearish results. Yet, the demand tail suggested bargain hunting activities as it was oversold.
- 19 Mar 2021: the results confirmed the presence of demand on 18 Mar 2021.
- 22 Mar 2021: the low volume suggested the fading of the demand hence the price stalled near 62.
- 23 Mar 2021: a secondary test of the selling climax formed on 18 Mar 2021 to test the supply. The volume is similar to 18 Mar 2021, yet the spread of the candle is smaller and the progress to the downside is lesser. This is Wyckoff's effort vs results where similar effort to push the price down, yet the downward results were lesser, suggested the presence of demand (which stopped the price from falling further)
- 24 Mar 2021: The presence of demand on 23 Mar 2021 was manifested and pushed the price up to test the resistance near 62.
- 25-26 Mar 2021: more testing on both the support (58) and resistance (62) with lower volume suggested exhaustion of supply.
Zoom into H4 smaller trading range from 29 Mar till today (12 Apr)
- Pay attention to the down wave (highlighted in orange) after attempting to breakout of the resistance. This reaction is not as sharp as per the previous reactions (highlighted in blue). Also, it formed a higher low and bounced off from the intermediate support at 59.4. Lower supply was observed.
- The downwave (orange) created a spring (a temporary commitment below the support at 59.4 with a quick recovery) followed by a test of the spring on 1 Apr with aggressive demand (as shown in the demand tail).
Bullish Scenario
- This could suggest the timing for a sign of strength rally to break above the resistance at 62 to confirm the bullish scenario.
- A backup action (as illustrated in the chart below) is required to confirm its intent to start the markup phase to test 63.5-64.
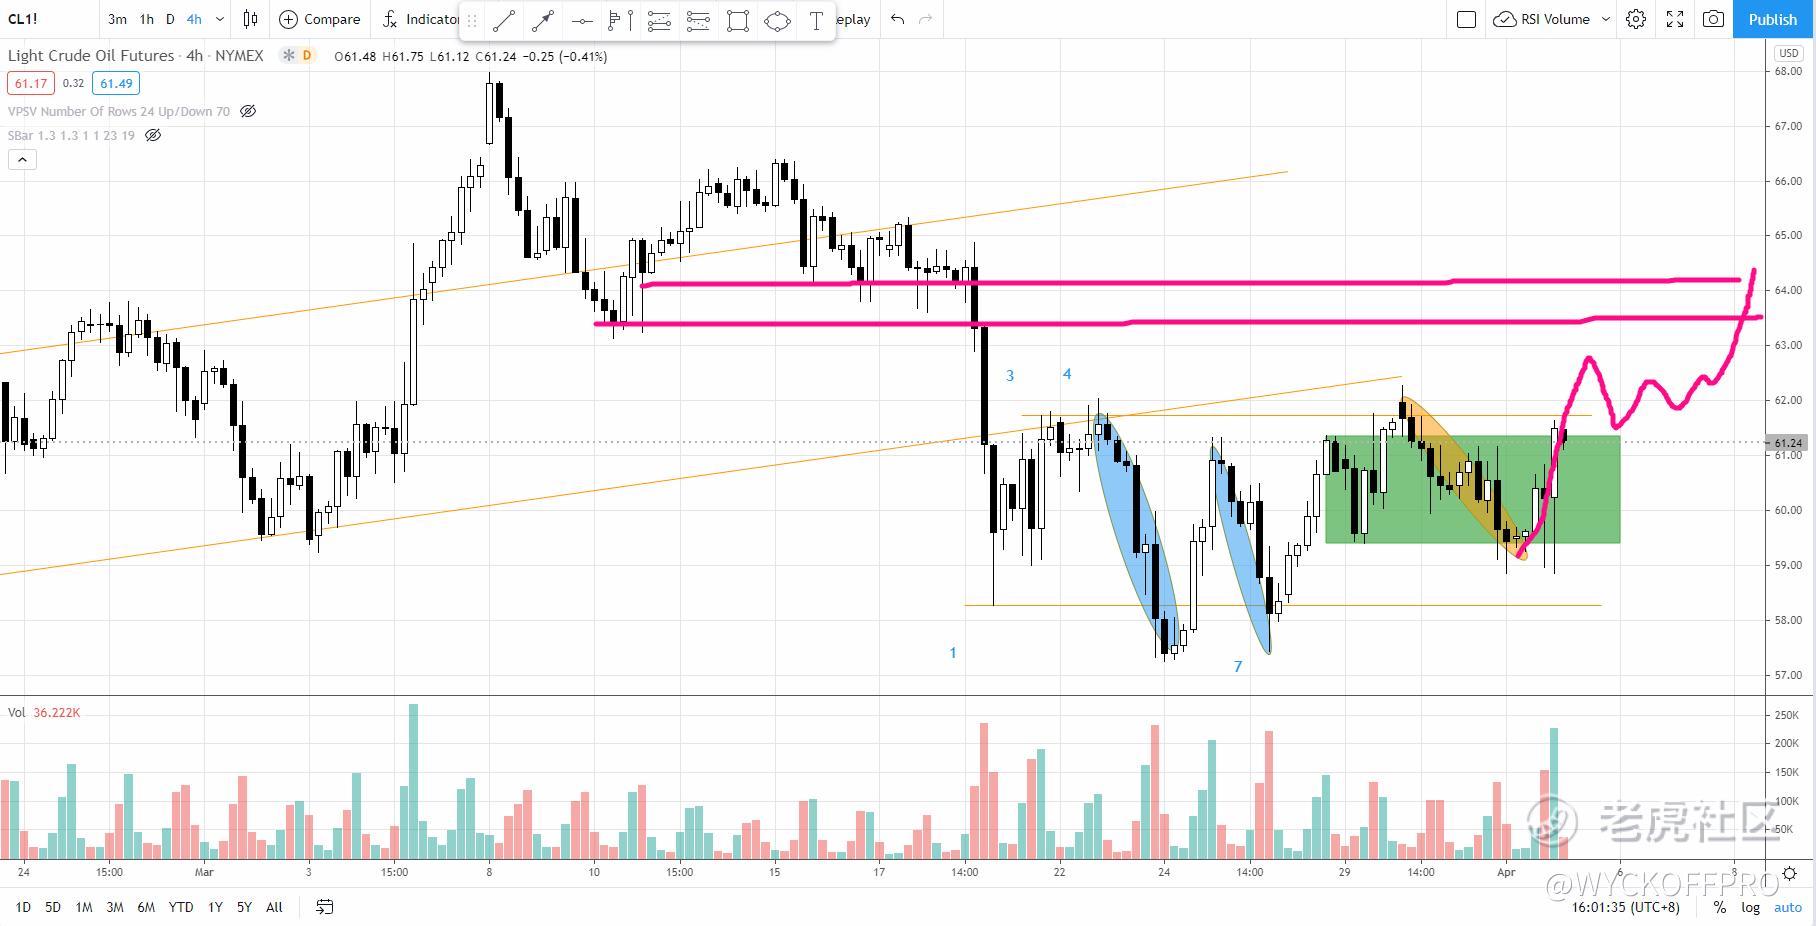
Failure Scenario
A failure of the breakout from 62 would signal more time to spend within the trading range 58-62.
What's your view on the crude oil? Below 58 or above 62
免责声明:上述内容仅代表发帖人个人观点,不构成本平台的任何投资建议。
1
举报
登录后可参与评论
- IcySilver·2021-04-02Below 58 for some time点赞举报