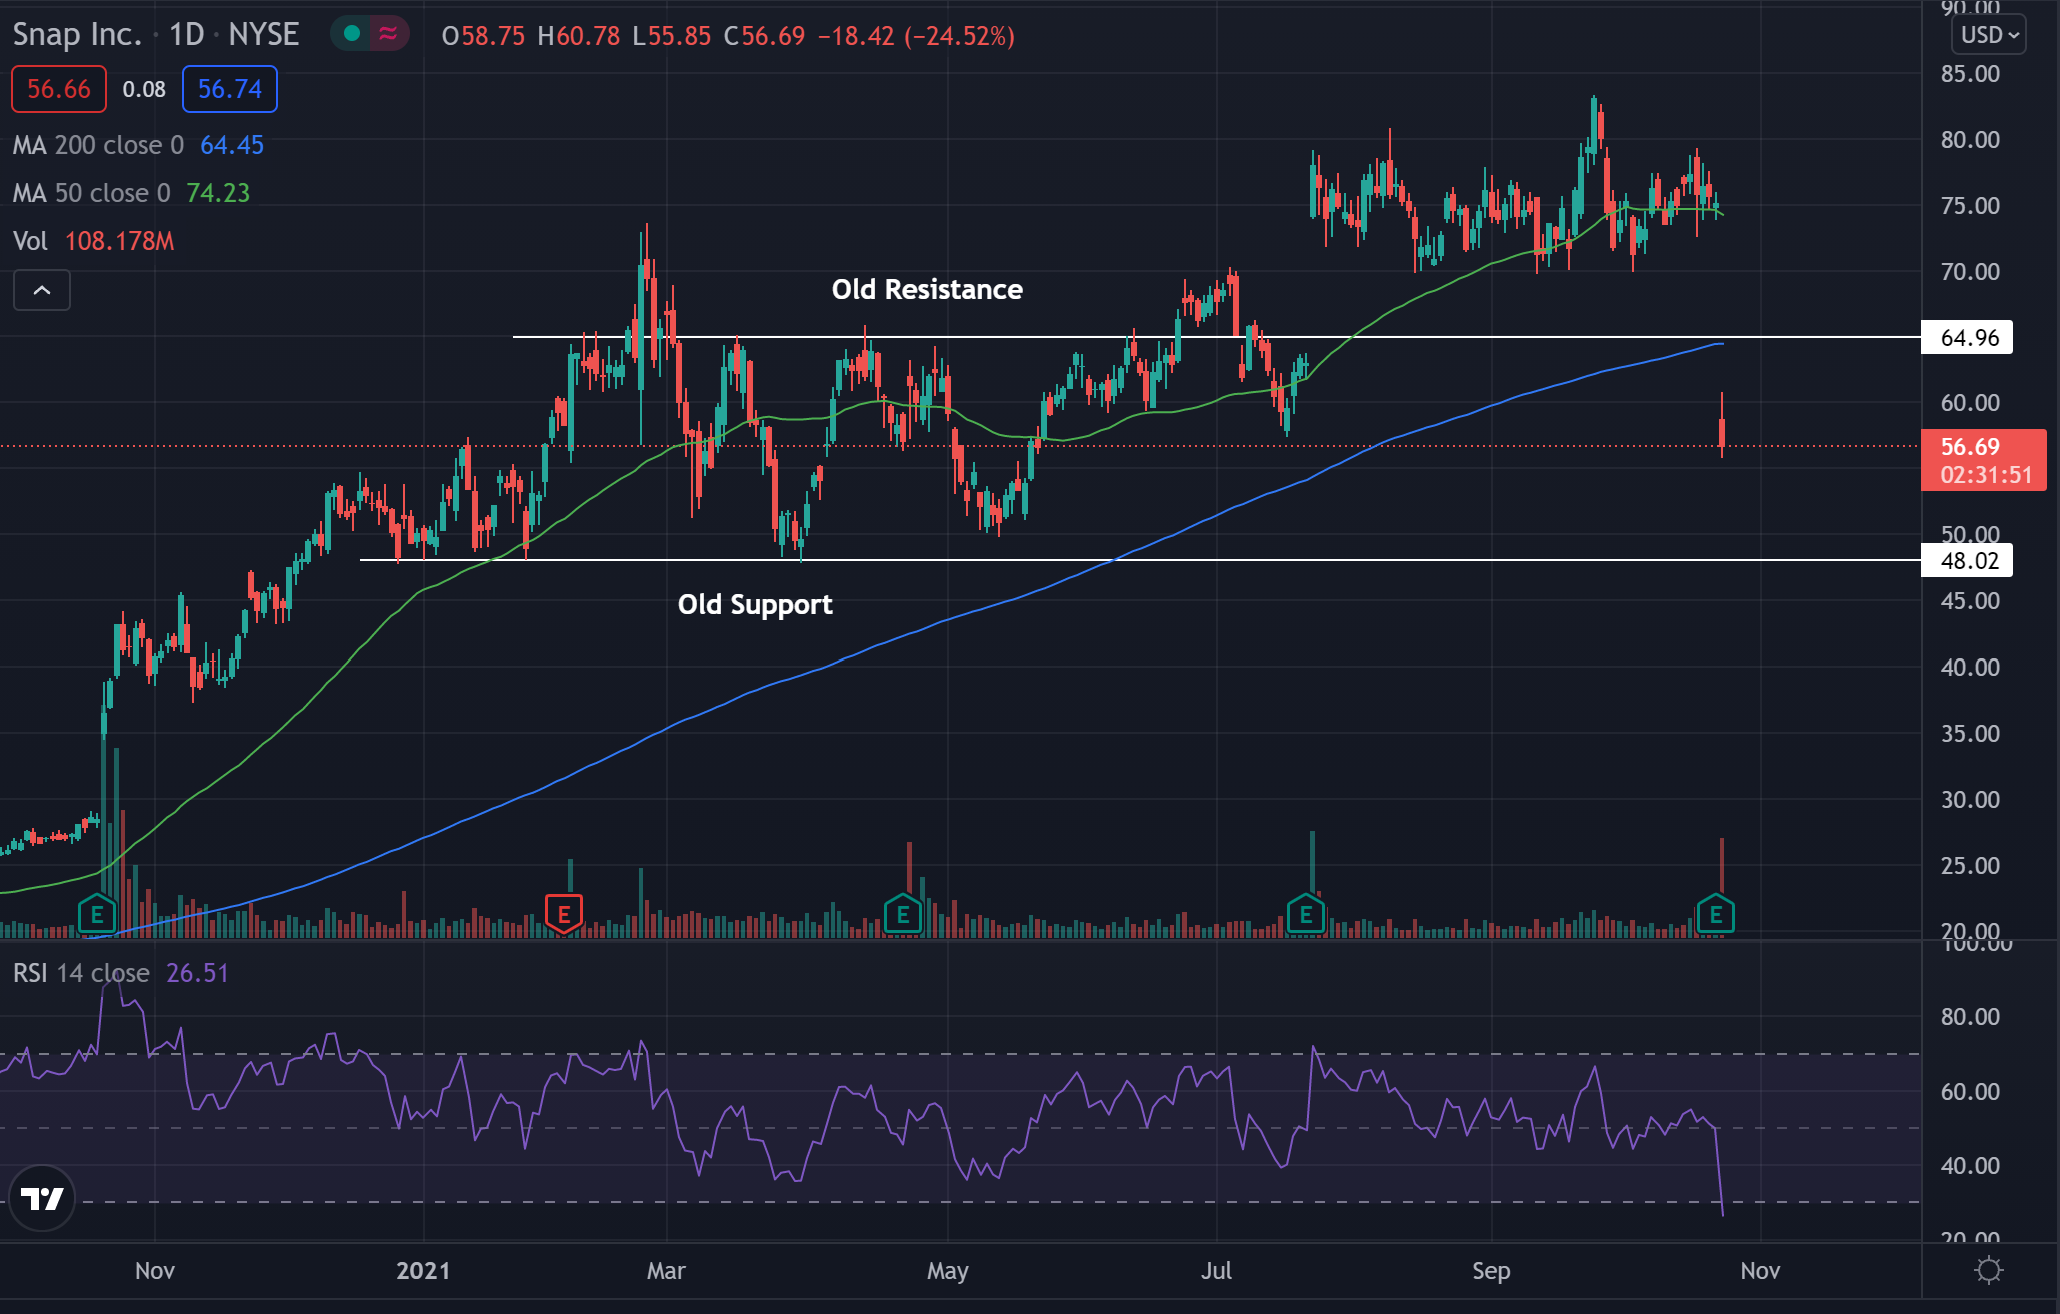
Snap Inc. (NYSE:SNAP) traded significantly lower Friday after the company announced worse-than-expected third-quarter revenue results and issued fourth-quarter guidance below estimates.
Snap reported quarterly earnings of 17 cents per share, beating the estimate of 8 cents per share. The company reported quarterly revenue of $1.07 billion, under the estimate of $1.1 billion.
Snap plunged 26.6% to $55.14 on Friday.
Snap Daily Chart Analysis
- Snap shares fell back into a sideways channel that it once traded in. The stock looked to have broken above the channel but after missing expectations, saw a large drop.
- Support was found near the $48 level in the past and may be found near here again in the future. Resistance has been found near $65 in the past and may hold again in the future.
- The stock trades below both the 50-day moving average (green) and the 200-day moving average (blue), indicating the stock’s sentiment has been bearish.
- Each of these moving averages may hold as an area of support in the future.
- The Relative Strength Index (RSI) saw a drop off down to the 26 level. This big drop pushed the stock into the oversold area where there are many more sellers than buyers.
What’s Next For Snap?
Bullish traders want to see snap start to recover from the large drop and start to form higher lows once again. Bulls are then looking for higher lows up to the resistance line before the resistance is broken. If the resistance can hold as support the stock may be ready for a large gap up.
Bearish traders are looking to see the stock continue to fade lower and eventually fall below the pattern support. If the pattern support could hold as an area of resistance, the stock could see further downward pushes in the future.


