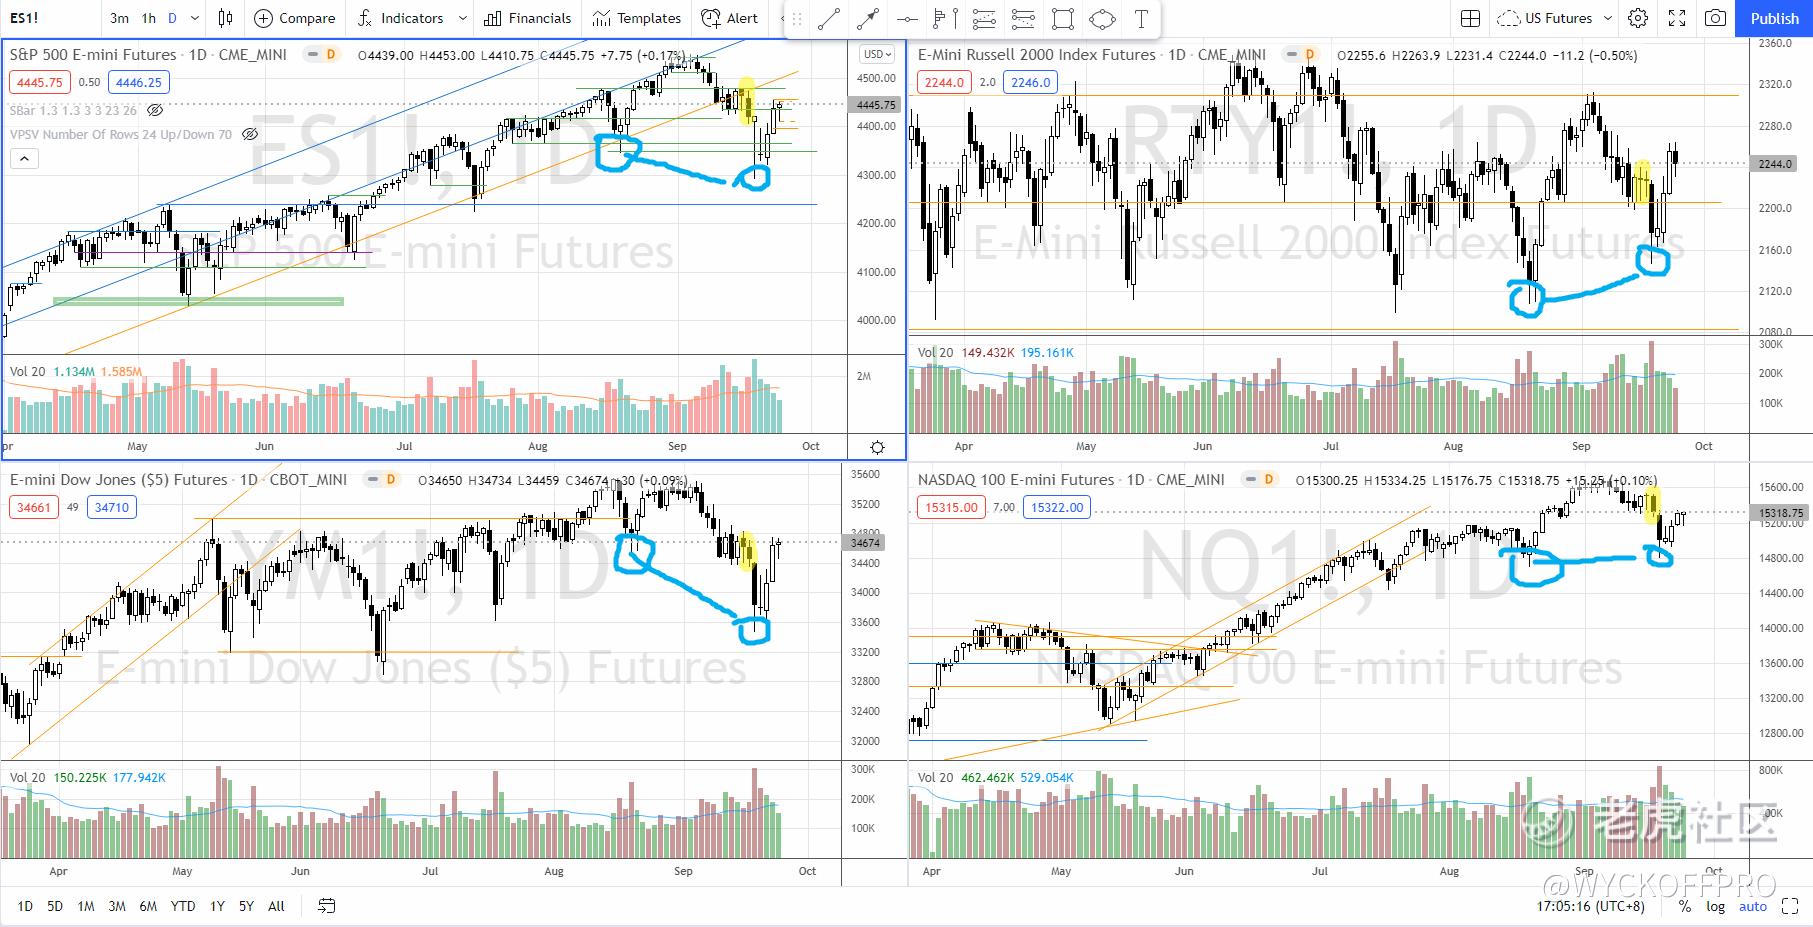
Last week, I mentioned the market is going down (Market is at a vulnerable point - what's next?) and 4350 is the support. Not only the support was hit in a day, the characteristics of the down move was sharp with spike of supply, which was totally off as my anticipation of a "grinding down" type movement.
The sharp movement was accompanied by lots of fear and panic as seen on the price action, which created a selling climax followed by an automatic rally (e.g. technical rally after an oversold condition).
Another key point from last week was a rotation from the big/mega cap to the small cap, especially the small-cap growth instead of a broad market selloff.

Now, let's analyze the comparative strength of the indices to find out why the small cap (Russell 2000) beat the rest of the indices.
Before we start the comparative strength analysis, it is essential to define the duration we want to compare, otherwise it is meaningless because the strength is different over different duration.
Let's start from the previous swing low (circled in blue) on 19 Aug 2021 as there was 1 up swing followed by 1 down swing.
Just by visual spotting the most recent swing low on 20 Sep and the previous swing low on 19 Aug, we have a clear winner here, which is the Russell 2000 because it forms a higher low, unlike $SP500指数主连 2112(ESmain)$ and the $道琼斯指数主连 2112(YMmain)$ . Although $NQ100指数主连 2112(NQmain)$ also formed a higher low, Russell 2000 definitely beat Nasdaq by a comfortable margin.
Another way to look at the strength is to compare the magnitude of the up swing from the swing low on 21 Aug to the swing high around 2 Sep, Russell 2000 had a gain of > 9%, almost double the gain of the other 3 indices.
The last thing that we can add is to compare the current bar (24 Sep) to 17 Sep (highlighted in yellow), the bar before the selling climax bar on 20 Sep. So far, only $罗素2000指数主连 2112(RTYmain)$ commits above.
What do all these mean?
Since 19 Aug, Russell showed stronger comparative strength than the other 3 indices and has fully recovered from the panic sell off on 20 Sep. This could suggest Russell 2000 to outperform the other 3 indices from here on because the smart money was rotated from the big/mega cap (S&P 500, Nasdaq 100) into the small cap (Russell 2000).
A breakout of the trading range in Russell 2000 will give the final confirmation.

Growth or Value?
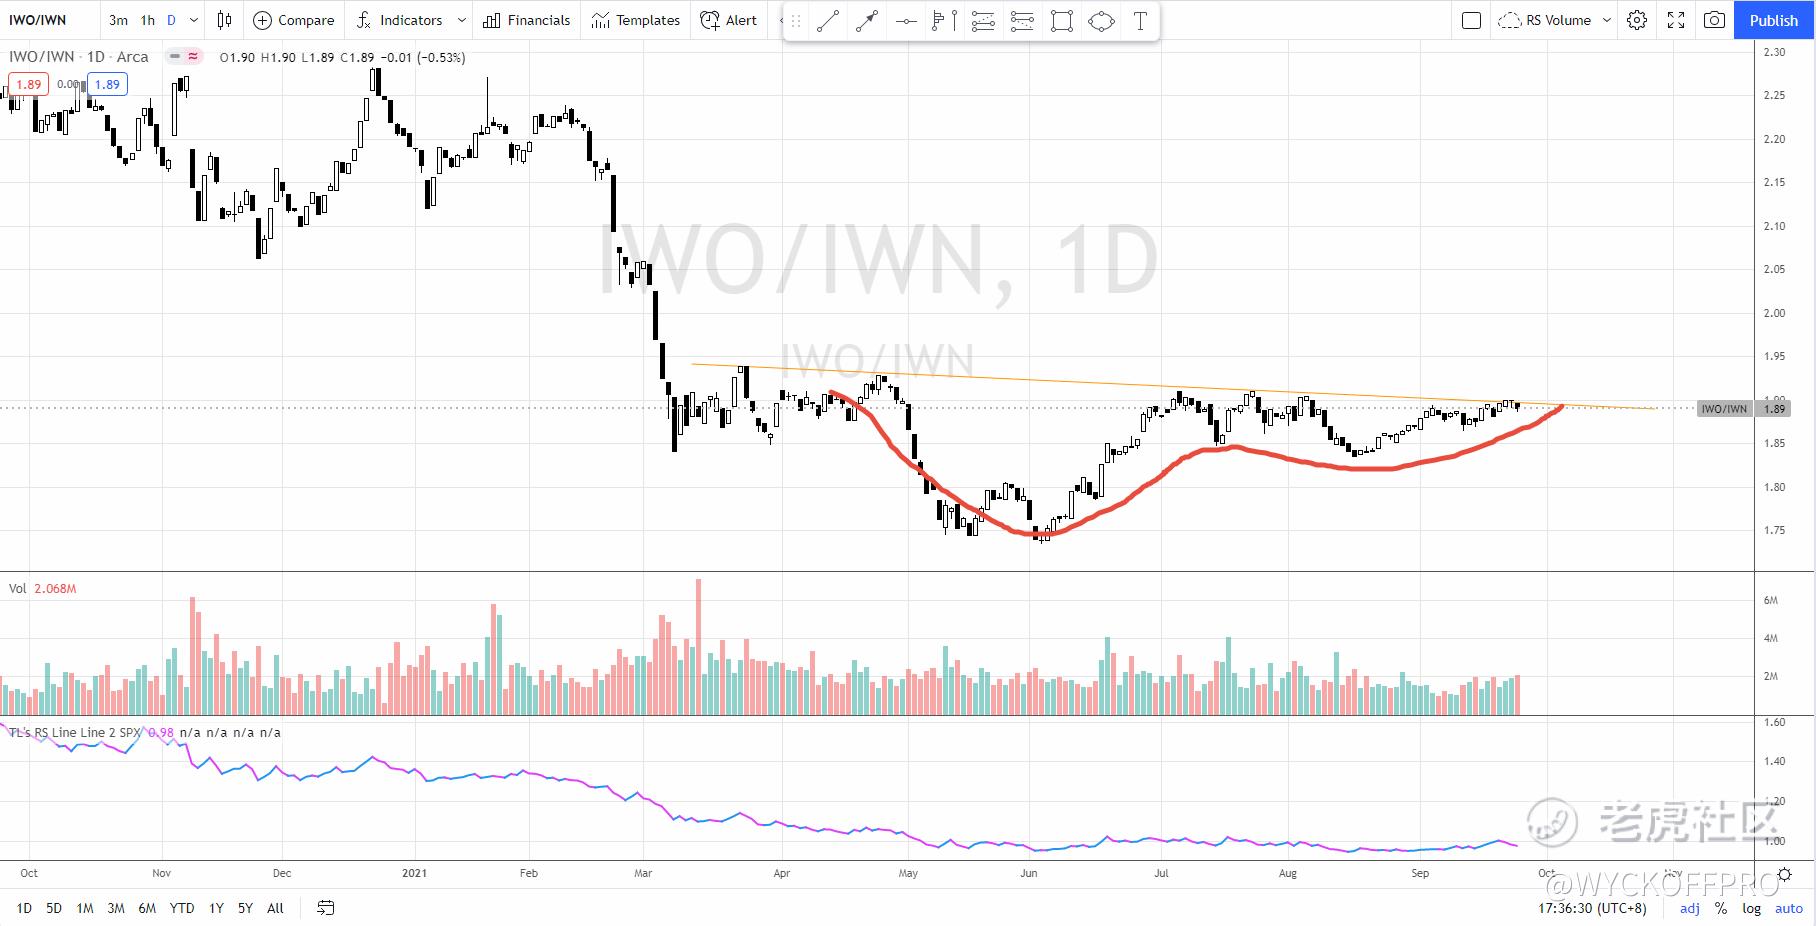
Another question: should we focus on value stock or the growth stock? The answer lies on the ratio chart above (IWO/IWN) where IWO is Russell 2000 Growth ETF and IWN is Russell 2000 Value ETF. If you look at individual chart, it might be hard to extract any useful information because both charts are in a trading range.
What does IWO/IWN mean? When the trend is going down, it means the growth ETF (IWO) is lagging over the value ETF (IWN).
A potential accumulation structure is forming since early March 2021 and is pending a breakout from the immediately resistance to kick start the uptrend. When it happens, this would mean the growth theme is leading over the value theme.
I am starting to see more and more stocks under the $罗素2000成长股指数ETF(IWO)$ ETF forming nice accumulation structure (if not already trend up). Plenty of trading /investing opportunities from this potential next biggest winner in the market!
Safe trading :) If you are day trading the US futures or swing trading for Malaysia and US stocks, feel free to check out my YouTube Channel: Ming Jong Tey for additional videos and resources. @Tiger Stars
精彩评论