In this video, I go over and answer some questions & analyzed charts from myTelegram Group members including $Palantir Technologies Inc.(PLTR)$ , $富途控股(FUTU)$ , $老虎证券(TIGR)$ , BIDU, XOM, PYPL to spot the direction, target price, any potential unusual behaviors and potential entry. Watch the video below:
Questions
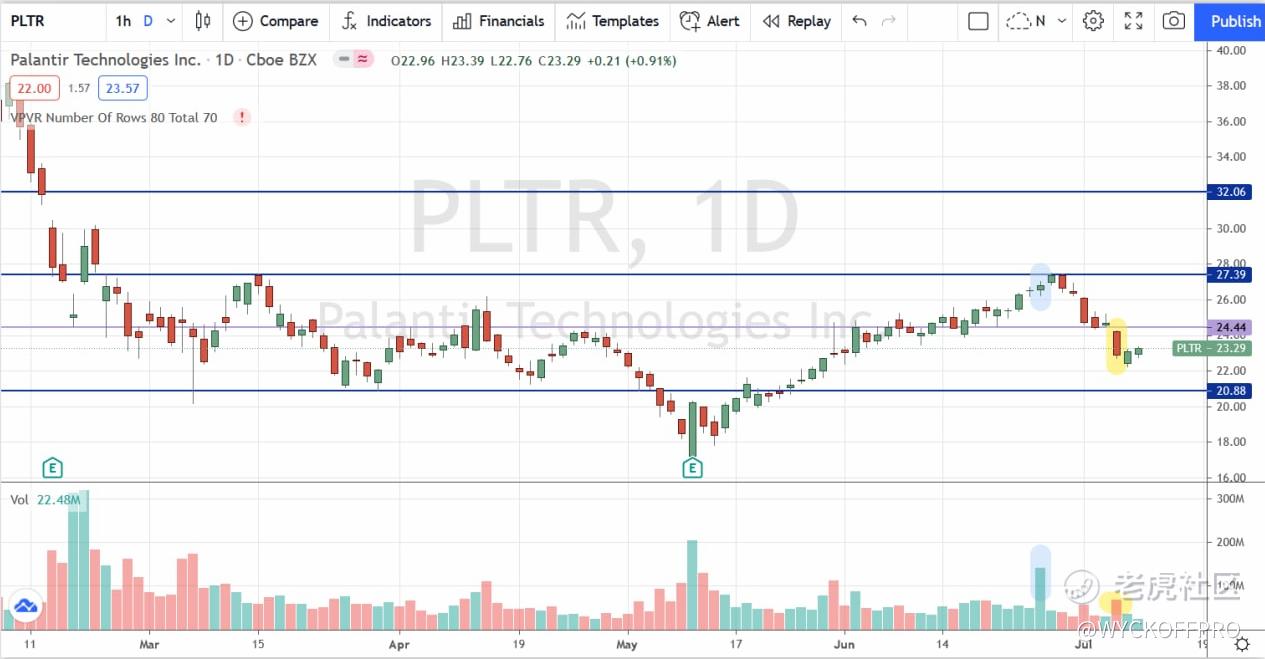
1) PLTR - checking on Palantir chart. The high volume but small doji-like candle in blue, was it indicative of hidden supply? Secondly, the yellow area, has demand returned and safe to enter around 23?

2) FUTU - What's your opinion?
3) TIGR - also similar pattern, another Chinese stock that was bashed down..
4) BIDU - was hit even harder…
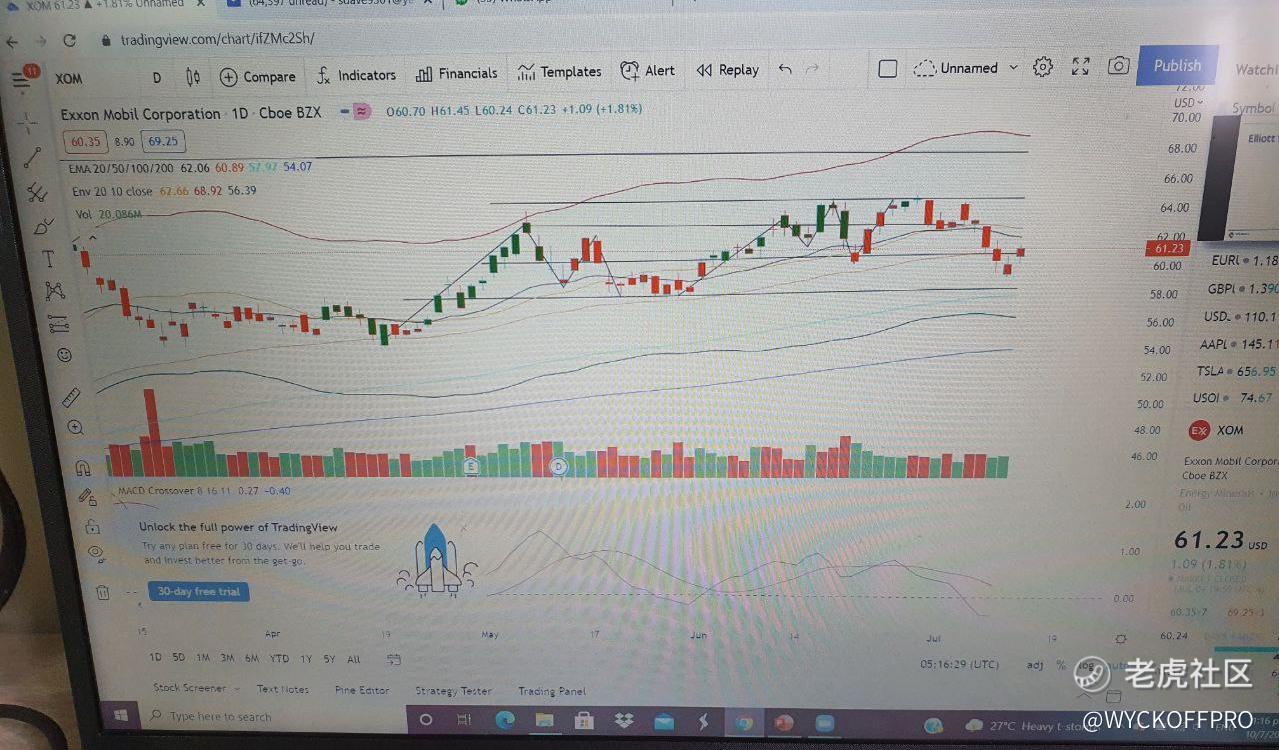
5) XOM - another stock i am using price action but this one i decided to try trading btw the support and resistance within the accumulation range. a. For a counter that is peg to oil price is the price volume indicator of supply and demand accurate? b. Can u clarify my understand of the two support range i identify in this ramge is there 2 zones of support or just one big one?

6) PYPL - Good call on paypal its now at 300 and i sold it at 290 plus. Now my question is with 4 green bar supply flat holding the price up will paypal do a backup or its scaling up ard day 5 if the Nasdaq continues
Watch the video below:
Timestamps
- 0:27 PLTR (Palantir Technologies Inc)
- 5:57 FUTU (Futu Holdings Limited)
- 9:58 TIGR (UP Fintech Holding Limited)
- 13:40 BIDU (Baidu, Inc)
- 16:30 XOM (Exxon Mobil Corporation)
- 20:58 PYPL (Paypal Holdings, Inc)
Further Reading
Q&A EP3: Price Action Analysis on PYPL, LQDT, FUBO, NIO, XPEV
2021 Week 28 - Marathon vs Trading & Investing? Market Update + Stocks to Watch
2021 Week 27 - 3 Stocks Set To Move Higher, Market Update & Growth Stocks Proxy
精彩评论