NIO: Potential Wyckoff Accumulation Phase D with Point & Figure Price Target Projection
Since the distribution happened in Feb 2021, $蔚来(NIO)$ has formed a selling climax (SC) on 5 Mar 2021 followed by an automatic rally (AR), which defined the trading range.
Wyckoff Phase Analysis
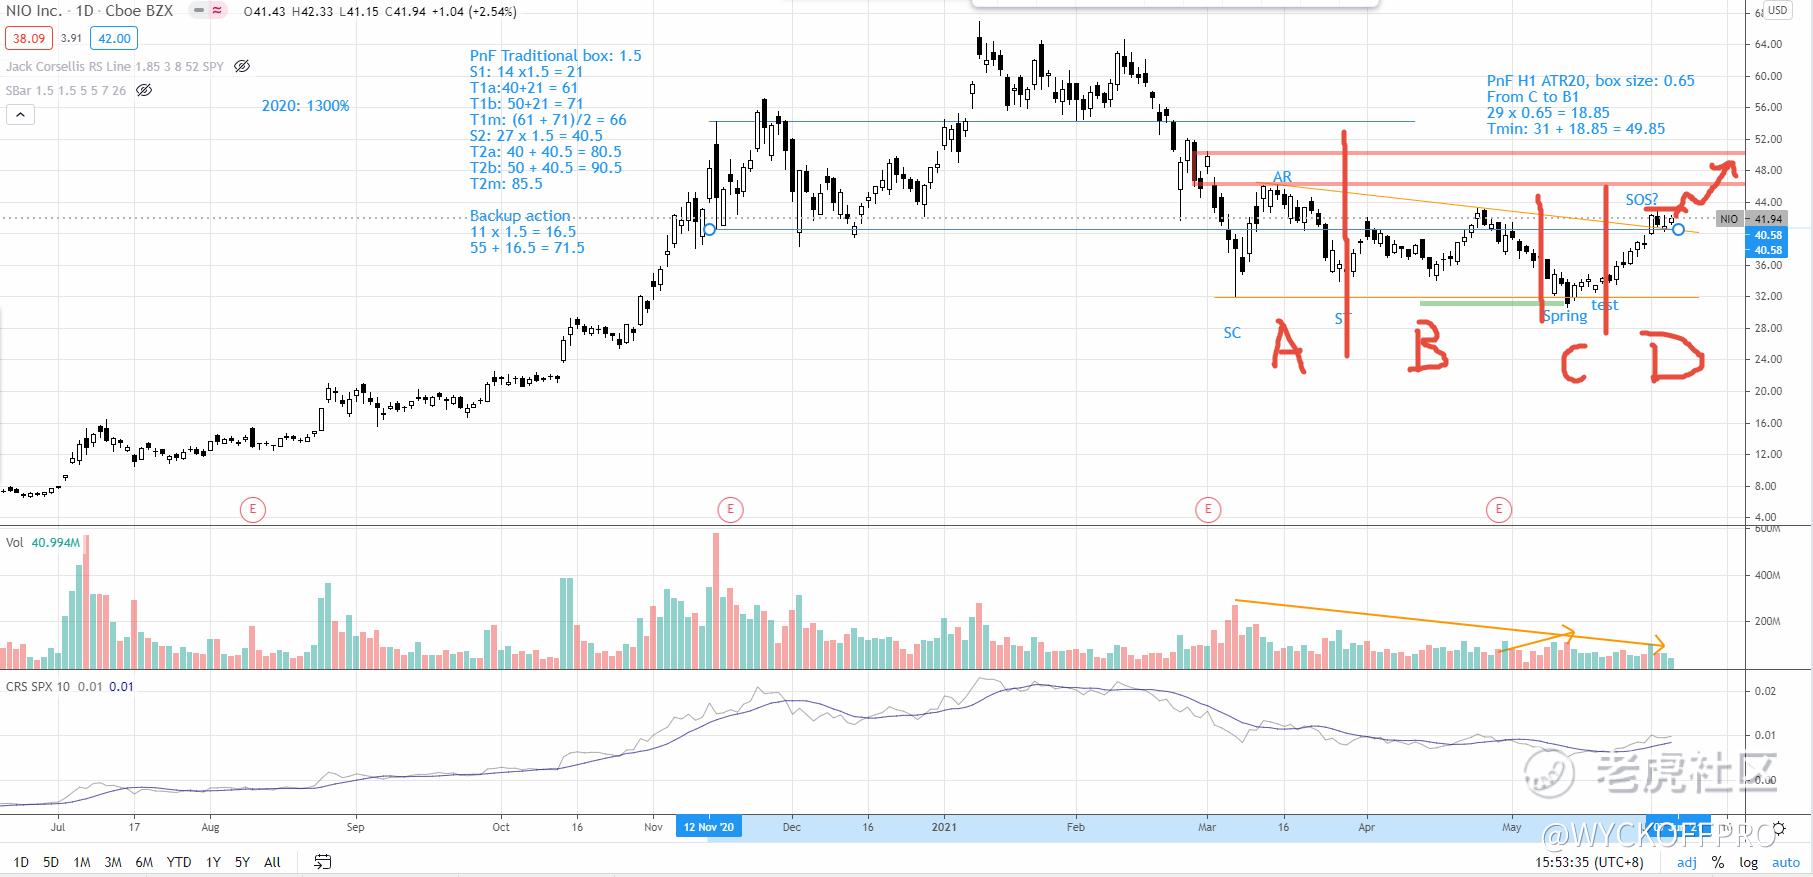
The selling climax comes with increasing of supply after reacting the earning announcement and even broke below the support at 40. Yet, there is no follow through to the downside. Instead, a trading range has formed.
A lower high has formed within the trading range despite increasing effort (volume) to the upside, suggests that there is presence of supply. The down wave from 27 April till 23 May created a second point of fear (sort of) with localised increased of supply and spring below the selling climax low.
The spring comes with increasing of supply and has been tested with a higher low and decreasing of supply, which is a successful test.
Supply has been decreasing throughout the trading range is a bullish character.
A commitment bar showed up on 24 May 2021 followed by a potential sign of strength rally. Right now, the price stalled at the resistance area with possible supply absorption characters. A commitment above 43 could suggest a start of a markup phase to test the upside target of 50 based on the point & figure (P&F) projection, as shown below.
Point & Figure price target projection
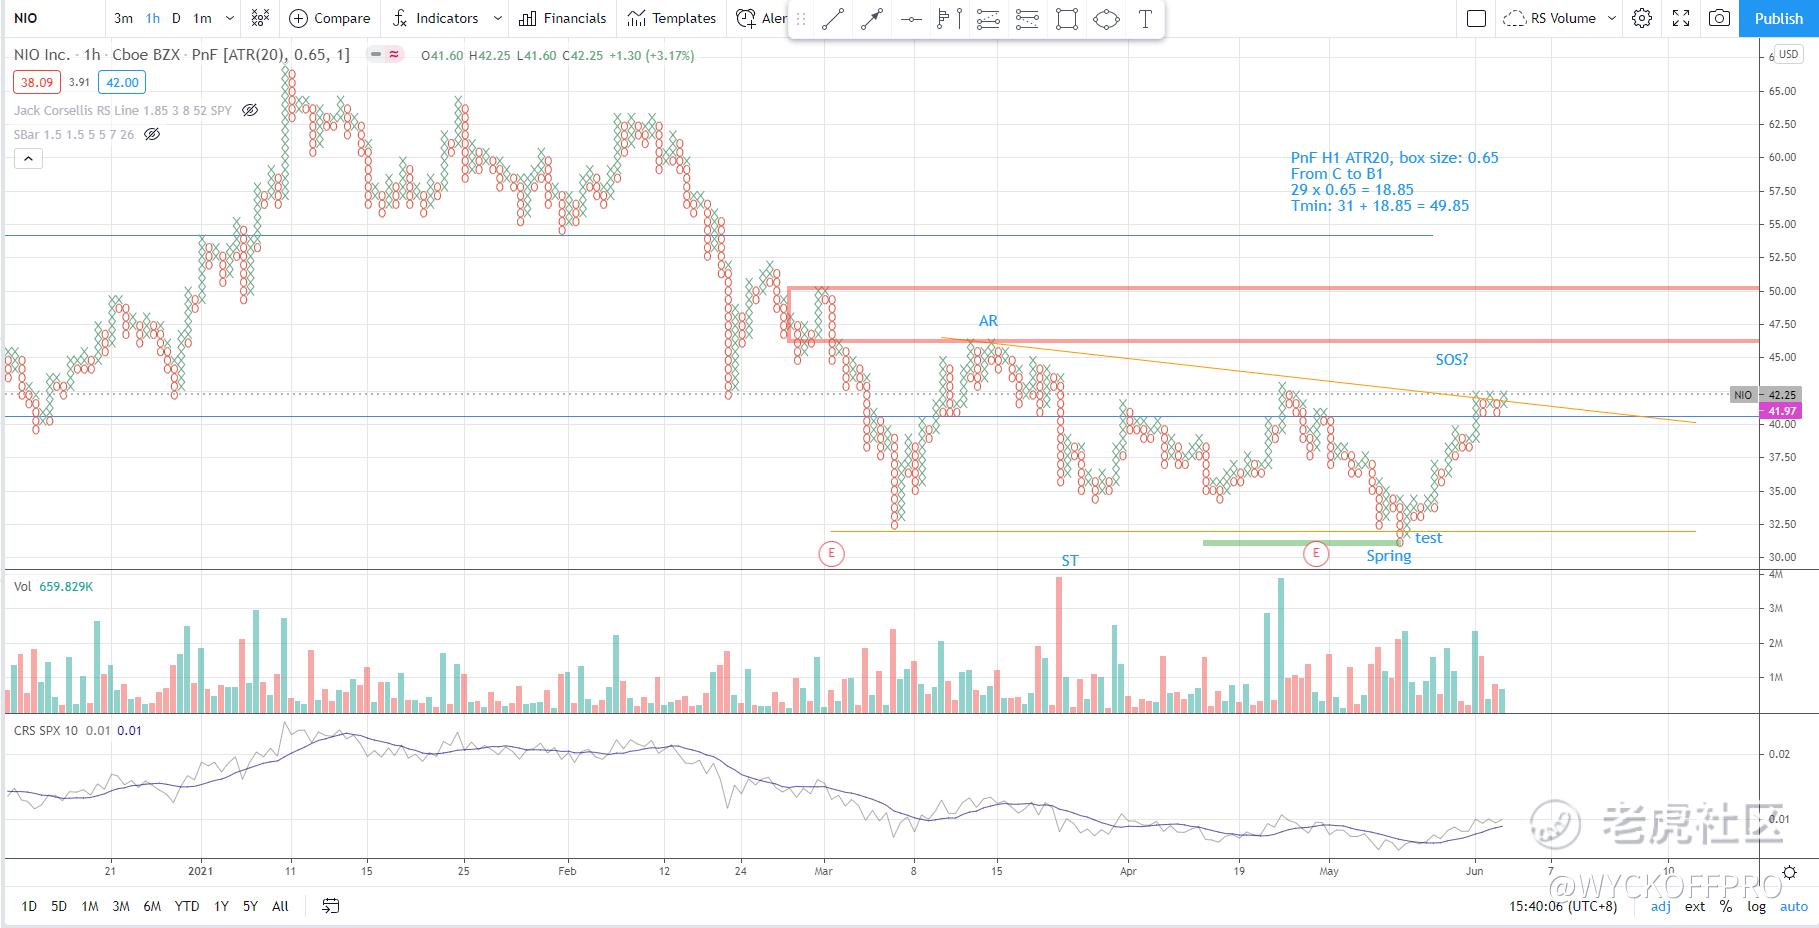
Based on the first segment (highlighted in green) with count line at 31, NIO has a minimum target price of around 50 should it commit above 43. Higher target can be estimated should the first target at 50 hit.
Failure case: a break below 39 could suggest the timing is not yet ready, and more time to be spent within the trading range.
免责声明:上述内容仅代表发帖人个人观点,不构成本平台的任何投资建议。