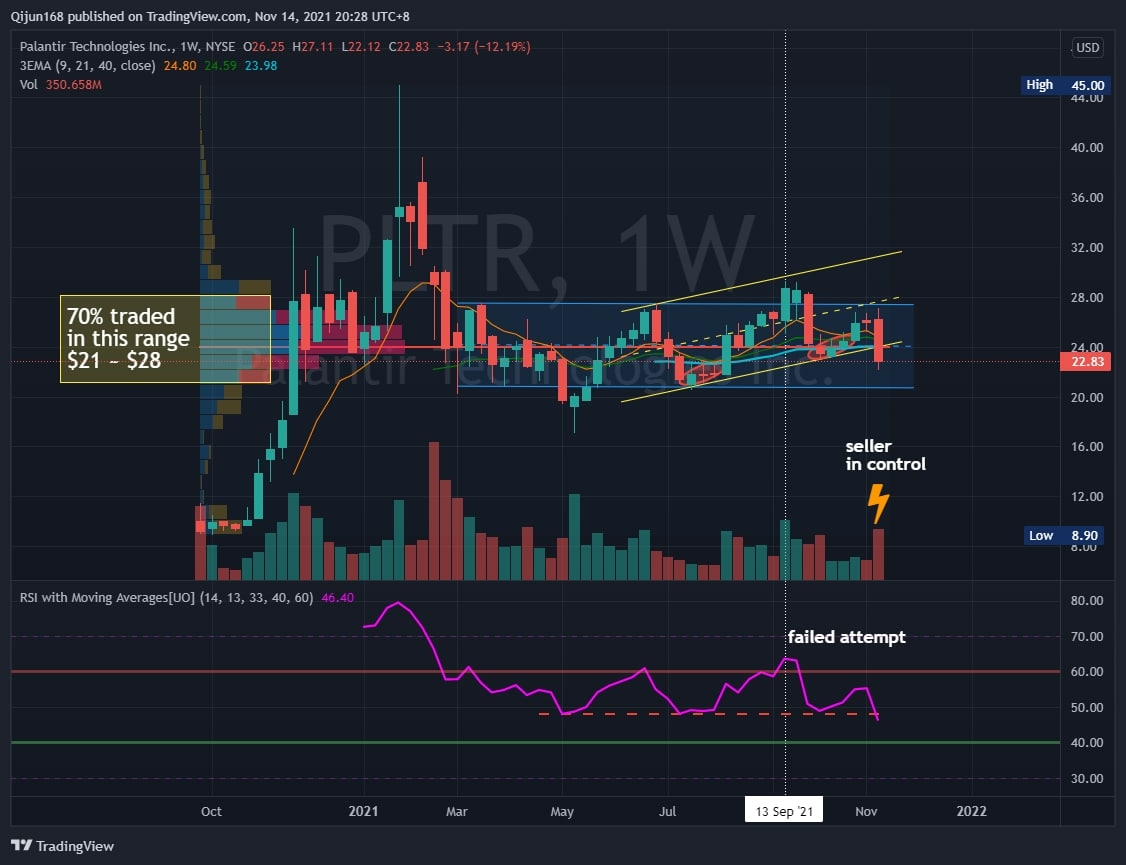
$Palantir Technologies Inc.(PLTR)$PLTR Weekly chart [$22.83]
- RSI dropped below 50 (bad)
- dipped below Yellow parallel channel, Big Red bar + Big Volume (bad, seller in control)
- Volume Profile since IPO shows that 70% traded ≈ $21 ~ $28
For long term investor (buy on weakness), i guess you know where to AIM (lower range of 70%)
Below $21 , you're probably in danger
IF 70% decided to give way of $21, what do you think?
My half pinch salt opinion, not vested yet.
免责声明:上述内容仅代表发帖人个人观点,不构成本平台的任何投资建议。
59
举报
登录后可参与评论
- EdithHardy·2021-11-16Thank you for sharing this, I think PLTR is now not so bad for a week-start. I'm LONG, NOT an option-eer, so I'm NOT expecting petty wins.4举报
- MurrayBulwer·2021-11-16I think we need to analyze the fundamentals of this company. If it is a long-term investment, we should pay attention to its fundamentals.4举报
- Huat99·2021-11-26struggling at 21 [安慰]1举报
- Huat99·2021-11-24share, conment, like1举报
- NinaEmmie·2021-11-16The yellow line indicates that the recent stock price has risen in shock. However, I am not very willing to invest in such a company with large stock price changes.1举报
- ElsieDewey·2021-11-16For me, its share price performance is not optimistic. I don't know whether the recent decline is a buying opportunity or a harbinger of continued decline.1举报
- Huat99·2021-11-16up up2举报