

Market is going down - beginning of selloff or rotation?

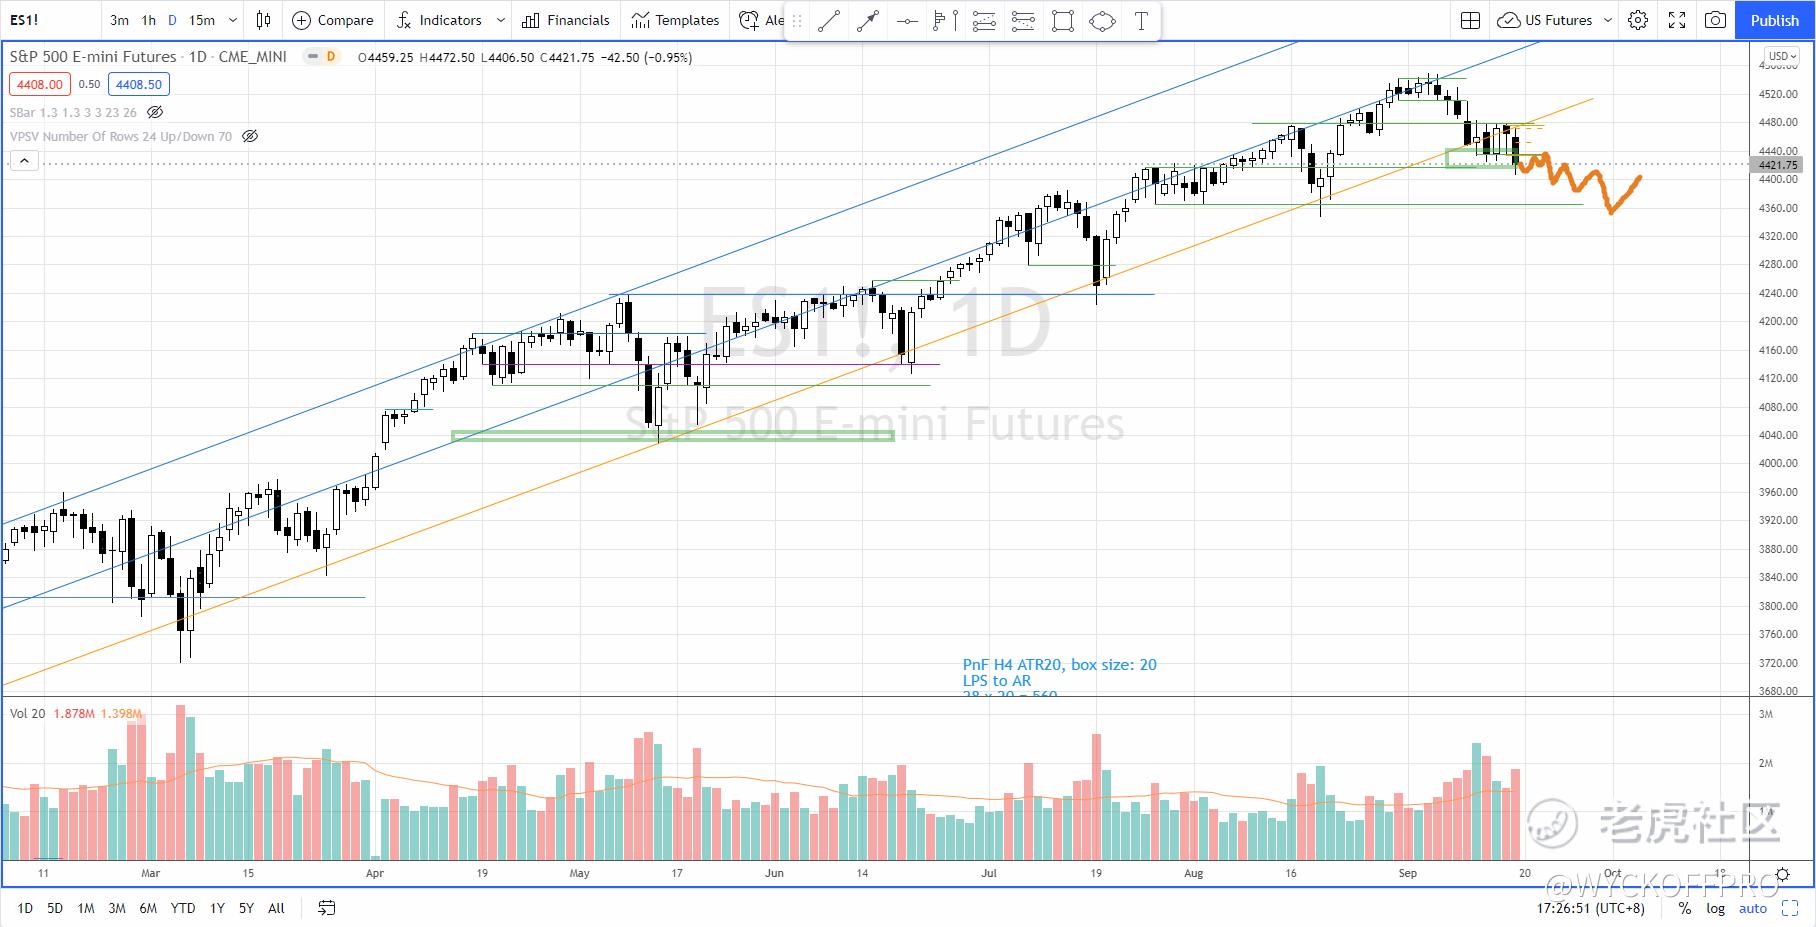
As mentioned last week (Market is at a vulnerable point - what's next?), immediate support for S&P 500 is around 4420. For a bullish case, I expect a reversal at support just like the past reactions since 2021.
After 1 week of forming a trading range between 4420-4480, S&P 500 broke below the support with increasing supply.
Directional Bias
My current directional bias is to the downside yet a reversal above 4440 could violate the bearish case. If it shows inability to rally up, S&P 500 is likely to test the lower support near 4350.
This potential down move might not be as sharp and furious as I anticipated last week, rather it could take days to develop with "grinding down" price action.
Refer to the chart below.
Despite the bearish price action as shown in the S&P 500, there are still selective stocks buck the trend and move up instead.
Rotation Scenario
Given the market internals such as VIX, market breadth, sentiment indicators, etc...together with the characteristics of the price action of the major indices, this could be a rotation from the big/mega cap to the small cap, especially the small-cap growth (Refer to ETF IWO) instead of a selloff of all stocks.
If you own Big/Mega cap stocks like $苹果(AAPL)$ , pay attention to the weakness manifested in the last week or so. Be it short term swing or long term investing, stick to your trading plan and react accordingly because the key is to manage the risk in your portfolio.
If you are wondering my posts about the super bull and the two proxies to confirm the super bull - what happen to the expectation of the super bull run?
As I mentioned, I am waiting for the two proxies (Russell 2000 and ARKK) to show leadership in order to confirm the super bull scenario. At the moment, the price structure is still unfolding and there is no confirmation yet.
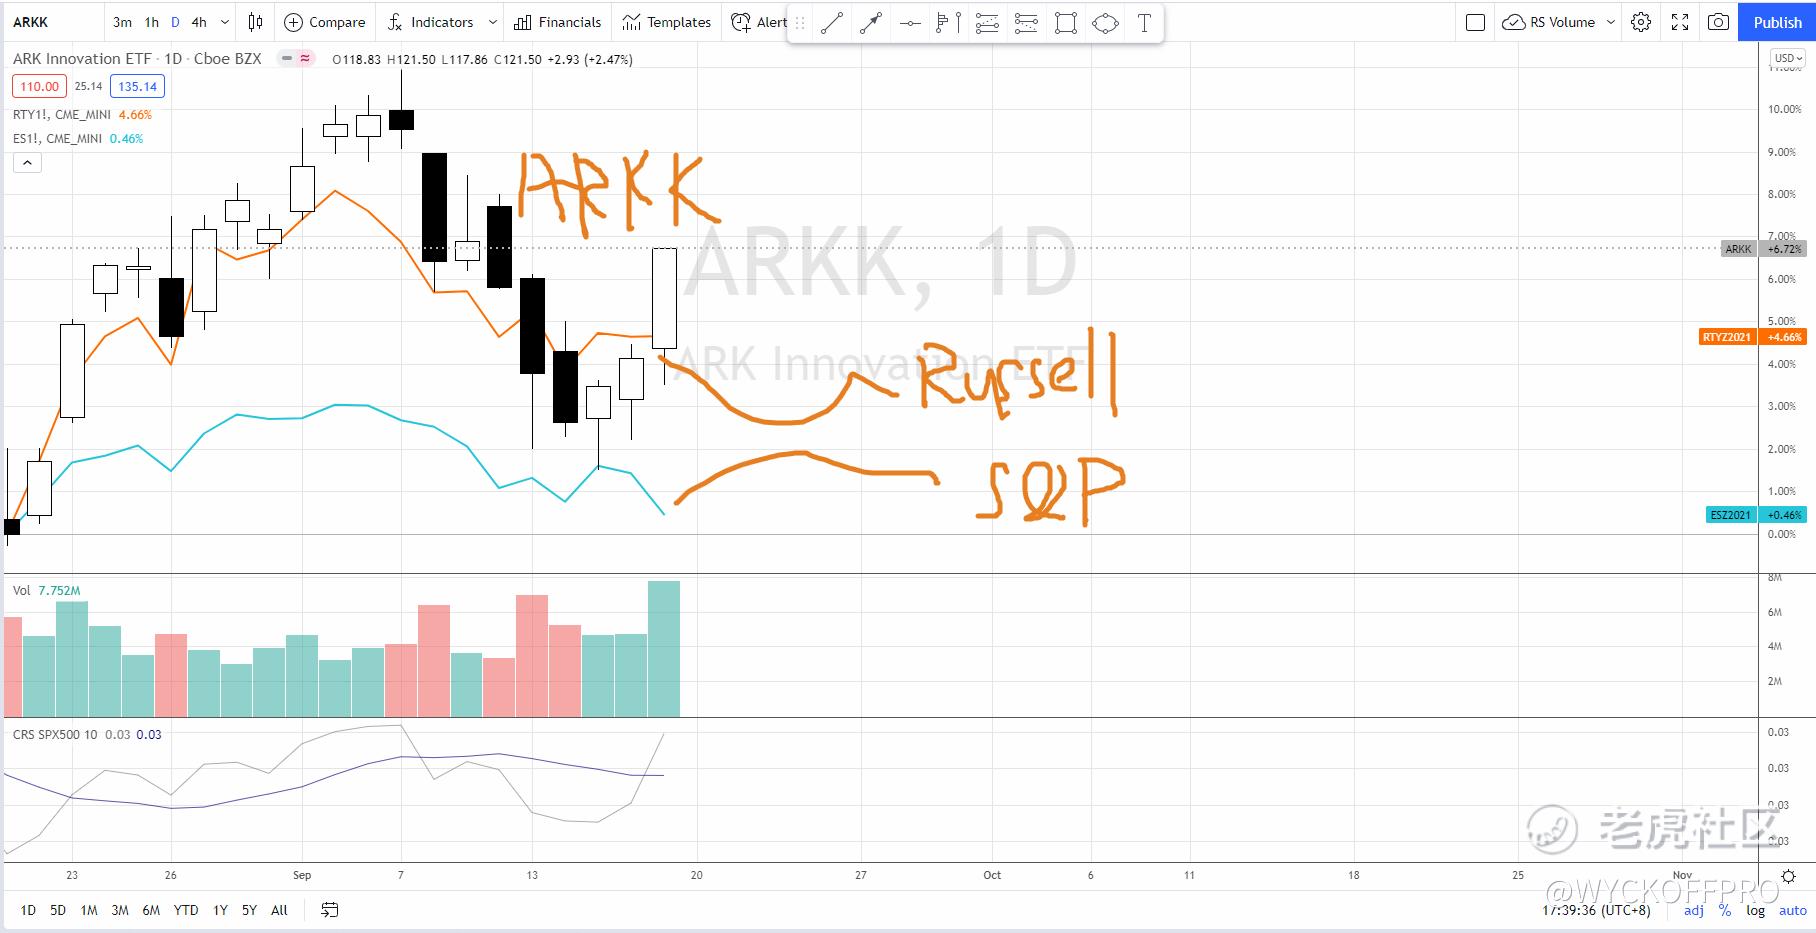
However, both $ARK Innovation ETF(ARKK)$ and Russell 2000 have outperformed the S&P 500 since a month ago, which is an encouraging sign for a rotation scenario. Refer to the chart above that compares the ARKK, Russell 2000 and the S&P 500.
For a super bull run scenario (The two proxies to confirm the super bull run), we could expect it lasts until next year Q1. So let's keep monitoring the proxies, indices and the stocks.
Safe Trading. If you are day trading the US futures or swing trading for Malaysia and US stocks, feel free to check out my YouTube Channel: Ming Jong Tey for additional videos and resources. $阿里巴巴(BABA)$ $中国恒大(03333)$ $微软(MSFT)$
Further Reading
Market is at a vulnerable point - what's next?
免责声明:上述内容仅代表发帖人个人观点,不构成本平台的任何投资建议。
- IcySilver·2021-09-20
![[666]](https://c1.itigergrowtha.com/community/assets/media/emoji_043_666.6738983c.png) let’s continue to monitor. Perhaps quadriple witching moved the market last Friday3举报
let’s continue to monitor. Perhaps quadriple witching moved the market last Friday3举报 - Cecilia2828·2021-09-25Well written
![[财迷]](https://c1.itigergrowtha.com/community/assets/media/emoji_003_caimi.53908f82.png) 3举报
3举报 - Kim888·2021-09-20
![[喷血]](https://c1.itigergrowtha.com/community/assets/media/emoji_018_penxue.86d62c8a.png) 2举报
2举报