
What websites I use for my trade setup - Part 1
For a passive (value) investor, I use few websites for my investment and research.
First, I look into the fundamentals of the different companies that I plan to invest in. I have set myself a rule - to at least go through their recent financials (annual performance of their income statement, balance sheet and free cash flow) before I invest. If the company shows good fundamentals, I will deep dive futher into their annual and quarterly earnings.
1. Yahoo Finance
The one that I used the most is the (free) Yahoo Finance:
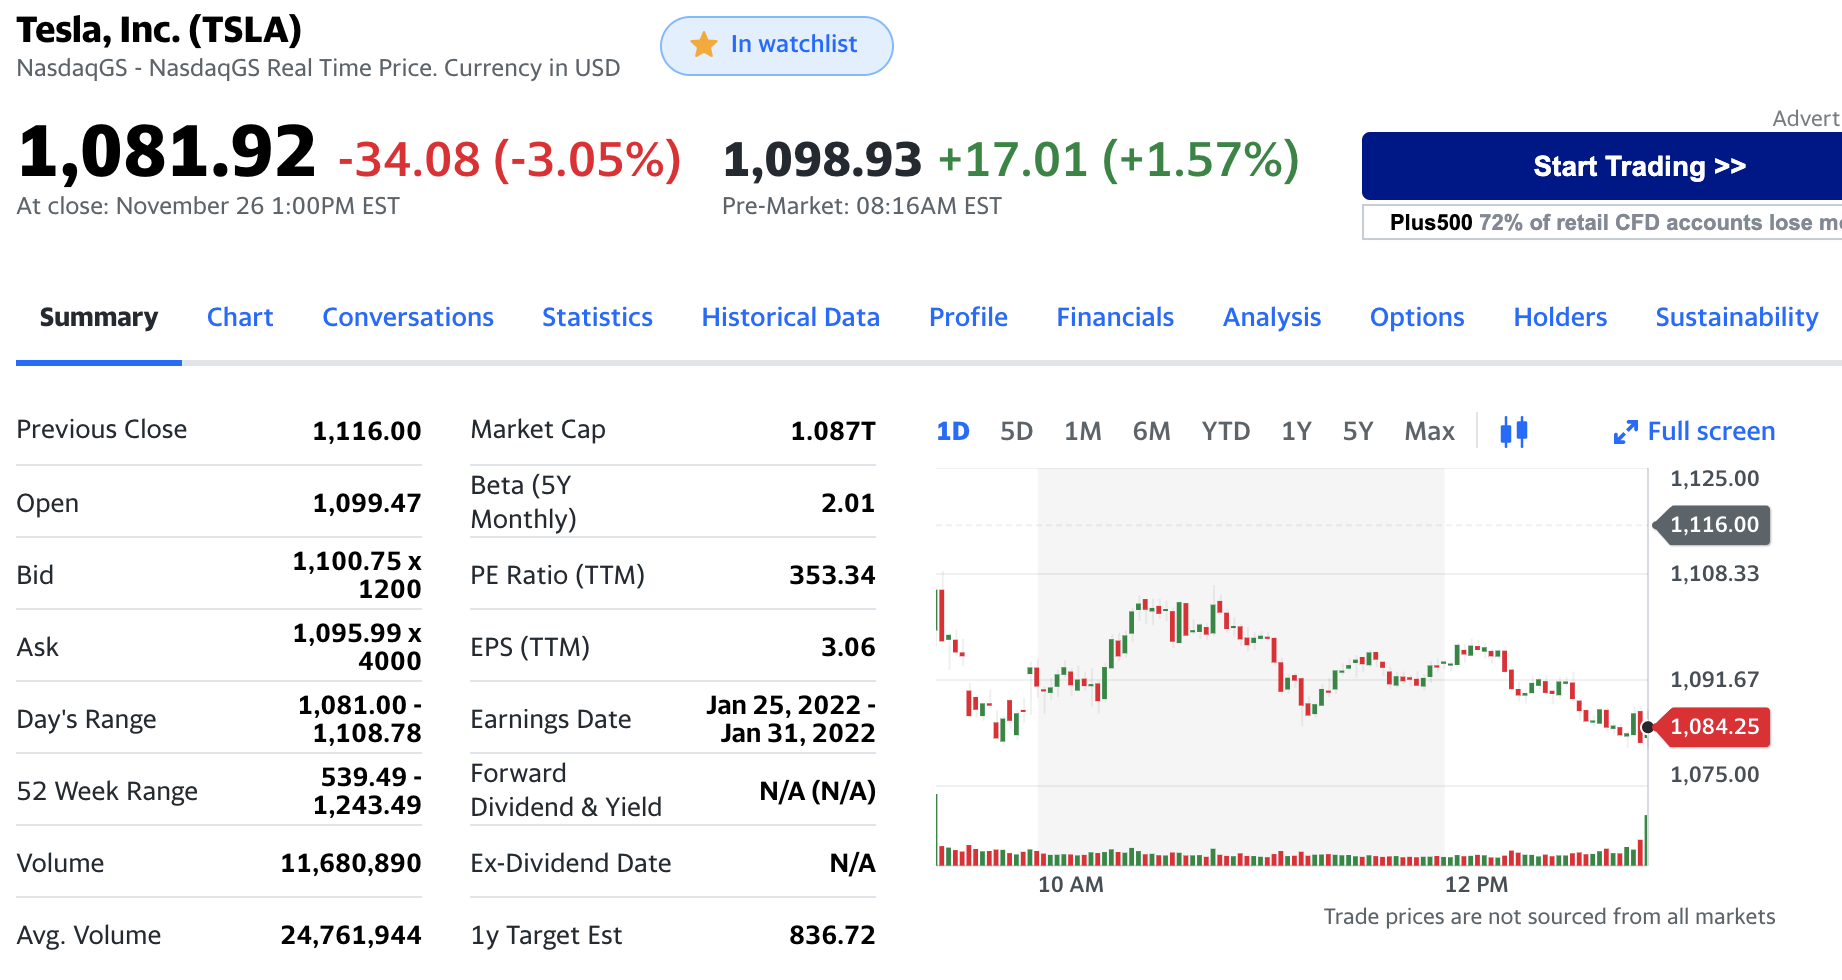
This is a good summary view from Yahoo Finance where I obtain average volume, PE ratio (TTM), EPS (TTM), Beta, Earnings Date, Dividend & ex-Dividend date. These are good ratios that provide a good “macro” view of the business. Details determine destiny - we should go on into more details so that we have better confidence of the decisions we make. All these form part of our risk management. If you cannot explain the business to a young kid in 5-10 minutes, you probably do not know enough of the business to invest into them.
We do not always get it correct. I log my trades and review my decisions as I fine tune my approach - paying attention especially when I got these wrong. We should not be changing our strategy every few hours but we should “review” them regularly.
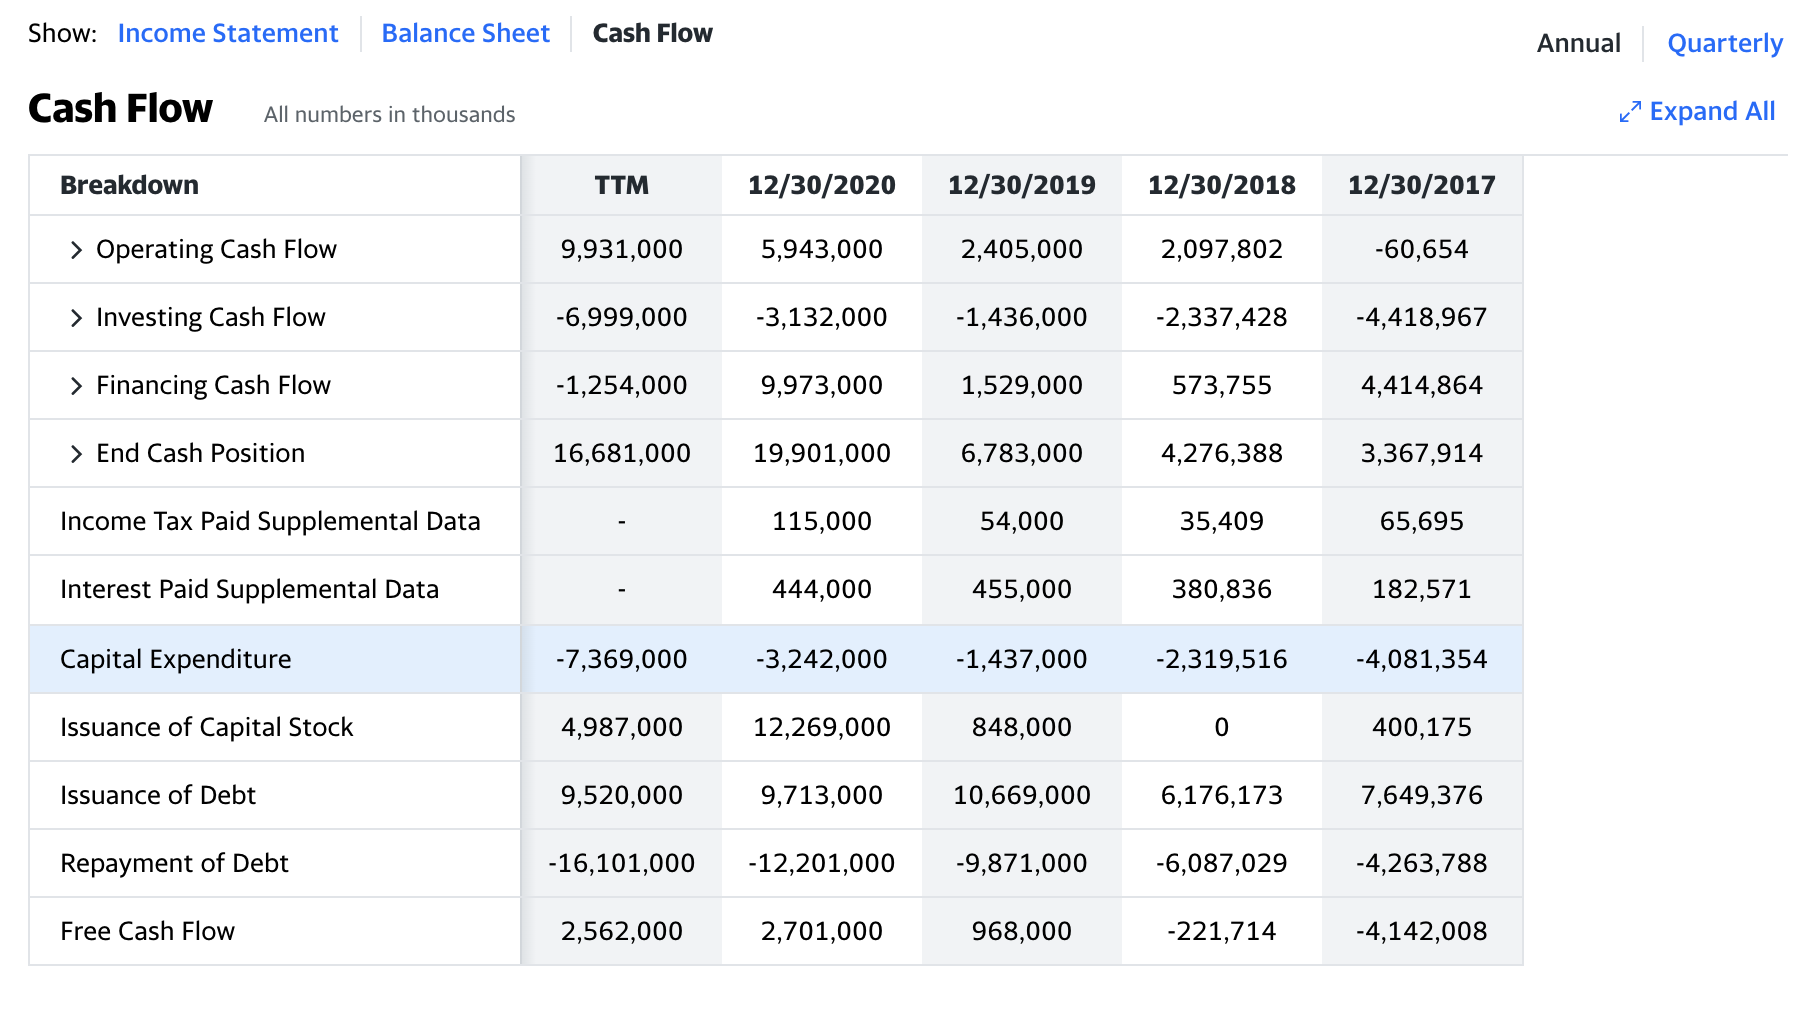
As per the screenshot from Yahoo Finance, I will be able to obtain the annual overview of the financial statements - income statement, balance sheet and free cash flow. If we need more details, Yahoo Finance should prompt us to subscribe to their PRO account. For me, the free account provides sufficient information that meet my current needs. Ideally, a 10 years record will be a good gauge to determine if the company has some competitive advantages.
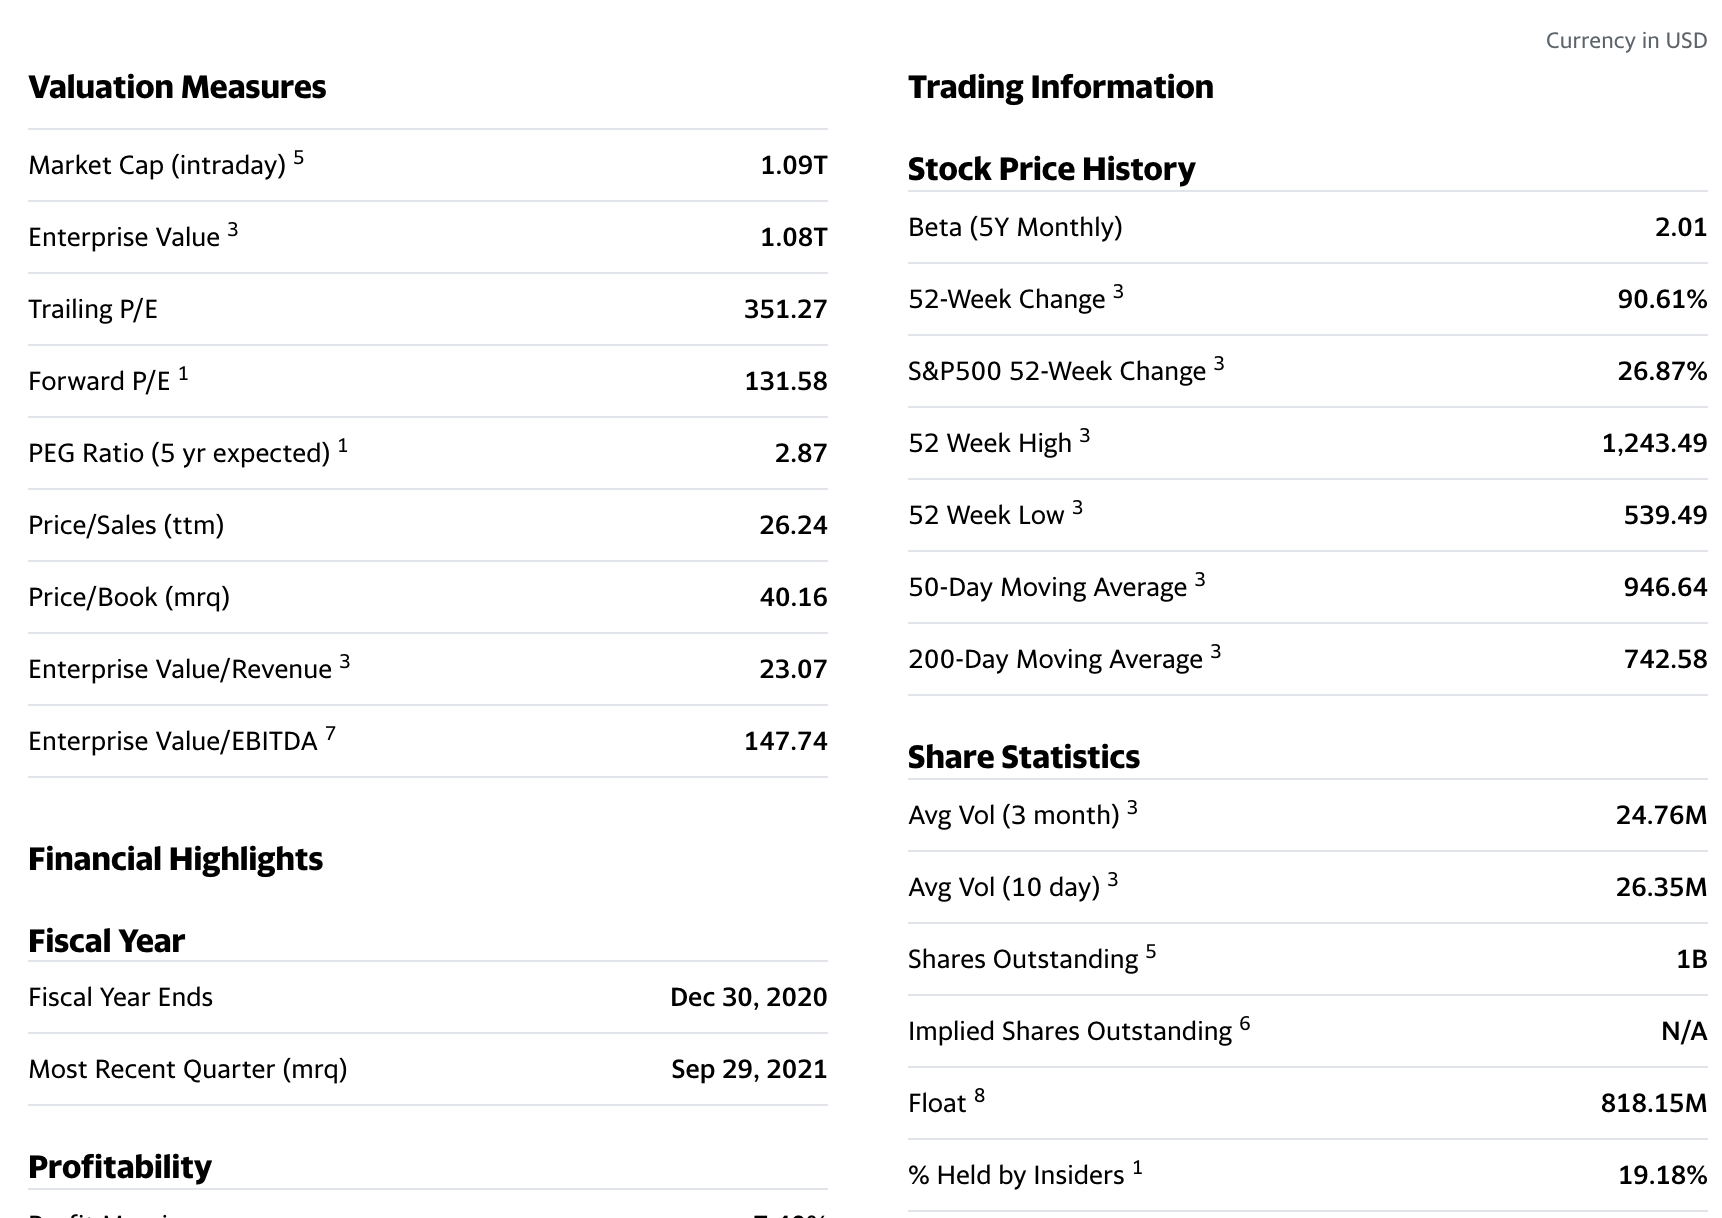
Yahoo Finance also has good overall of various financial statistics. Some of the information that I look into will include the PEG ratio, Price/Sales (TTM), Price/Book (MRQ), share ownership details (insider and institutional).
Setup of my trading chart
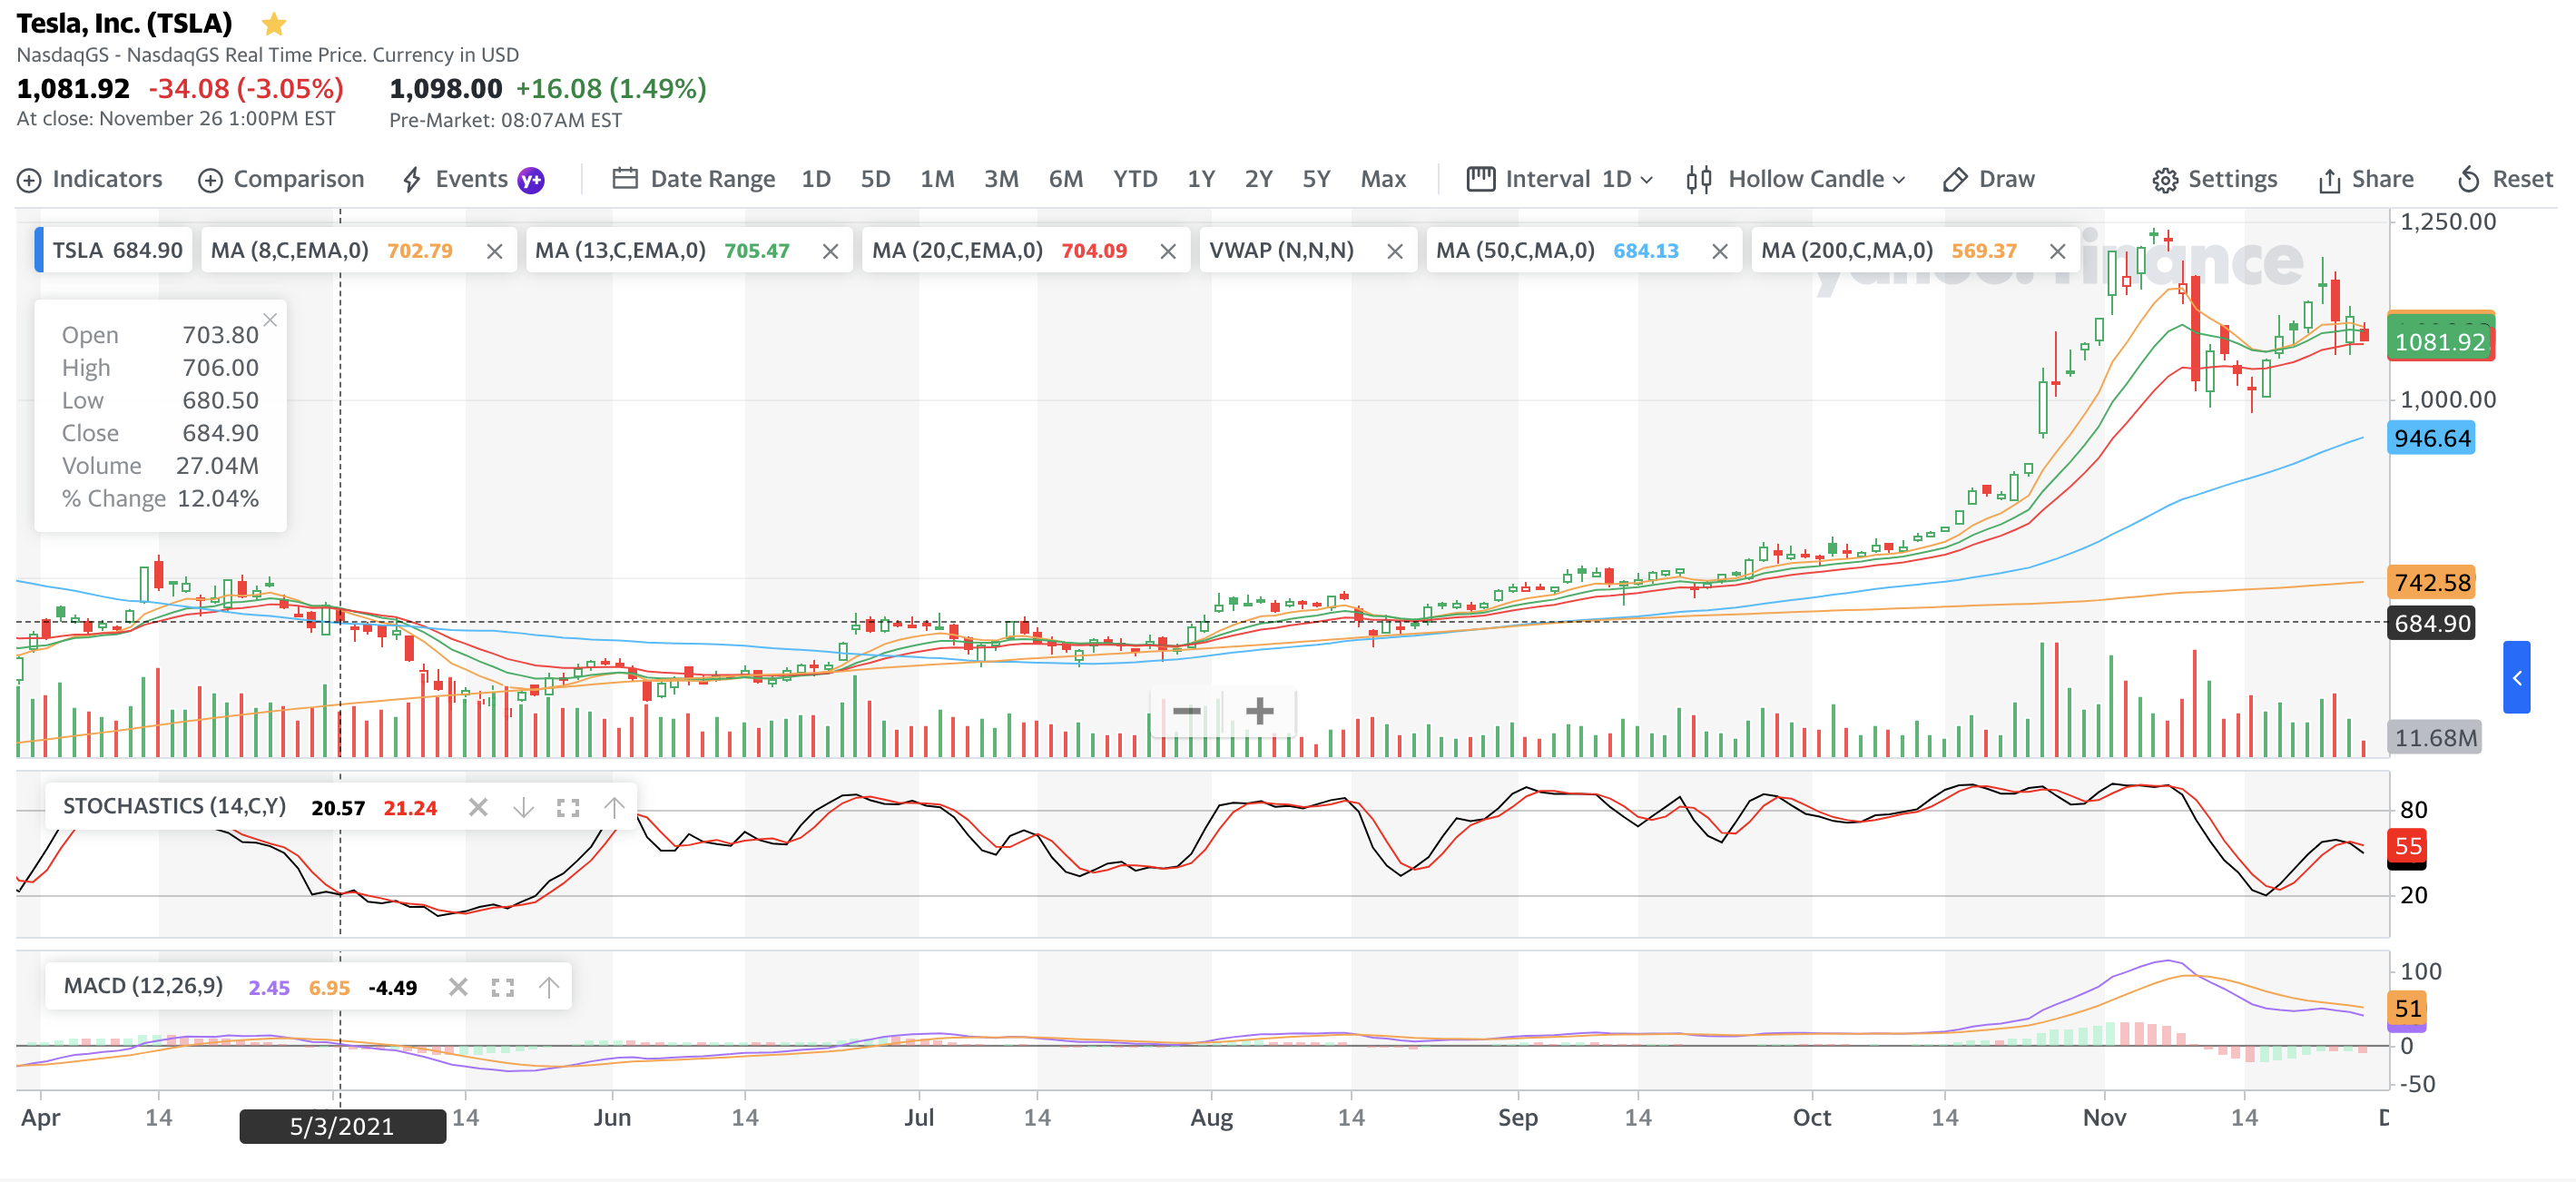
The above is my standard set up with 1 Day by default. After qualifying that the company has good fundamentals, I will incorporate technical indicators for my entry/exit. In my technical set up, I will add Exponential Moving Average - EMA (8, 13, 20), Moving Average (50 & 200) and indicators like MACD and Stochastic (slow stochastic if possible). EMA are good to identify moves & reversals but these are noisy and issue false signals. For 1 Day moving averages, I will typically look out when MA 50 cuts MA 200. If MA 50 cuts MA 200 from below, it is known as “Golden Cross”, a typical “bullish” signal. The opposite is known as “Death Cross”, a typical “bearish” signal.
Short term trading
For those who plan to do (short term) trades, we can consider adding Average True Range (ATR) as guide on how much the price may move. Usually, I will first identify the trend and will wait for 1-2 indicators to confirm the trend before I take up a position. This can be our guide using [entry price +/- ATR] to set profit (TP) and stop loss (SL) positions. It is recommended that we do not put more than 2% of our total capital per trade. For risk management, do not concentrate your positions into certain sectors only and I would invest also in different countries. The other ways will be for us to identify the support and resistance levels or use Fibonnaci for TP & SL.
We should not crowd out our trading screen. Personally, I still think that my screen is too “cluttered”. Sometimes, we should just follow simple price actions for our short term trades.
Price Action (as per explained by Investopedia)
Price Action trading relates to recent historical data and past price movements, all technical analysis tools like charts, trend lines, price bands, high and low swings, technical levels of support, consolidation and resistance are taken into account as per trader’s choice and strategy fit.
Please backtest our setup always - this will help us to identify the “false” signals and how we can better use the information. Remember, there is no perfect setup and there are many reasons like black swans (covid variant, etc) that affect the stock price.
Do note that the above was my “previous” trading style as I turn to investing with long term time horizon.
免责声明:上述内容仅代表发帖人个人观点,不构成本平台的任何投资建议。
- Twelve_E·2021-11-30Great ariticle, would you like to share it?2举报
- koolgal·2021-12-01谢谢分享你的建议。1举报
- KYHBKO·2021-12-01my pleasure. you have been most generous to the tiger community too. all the best点赞举报