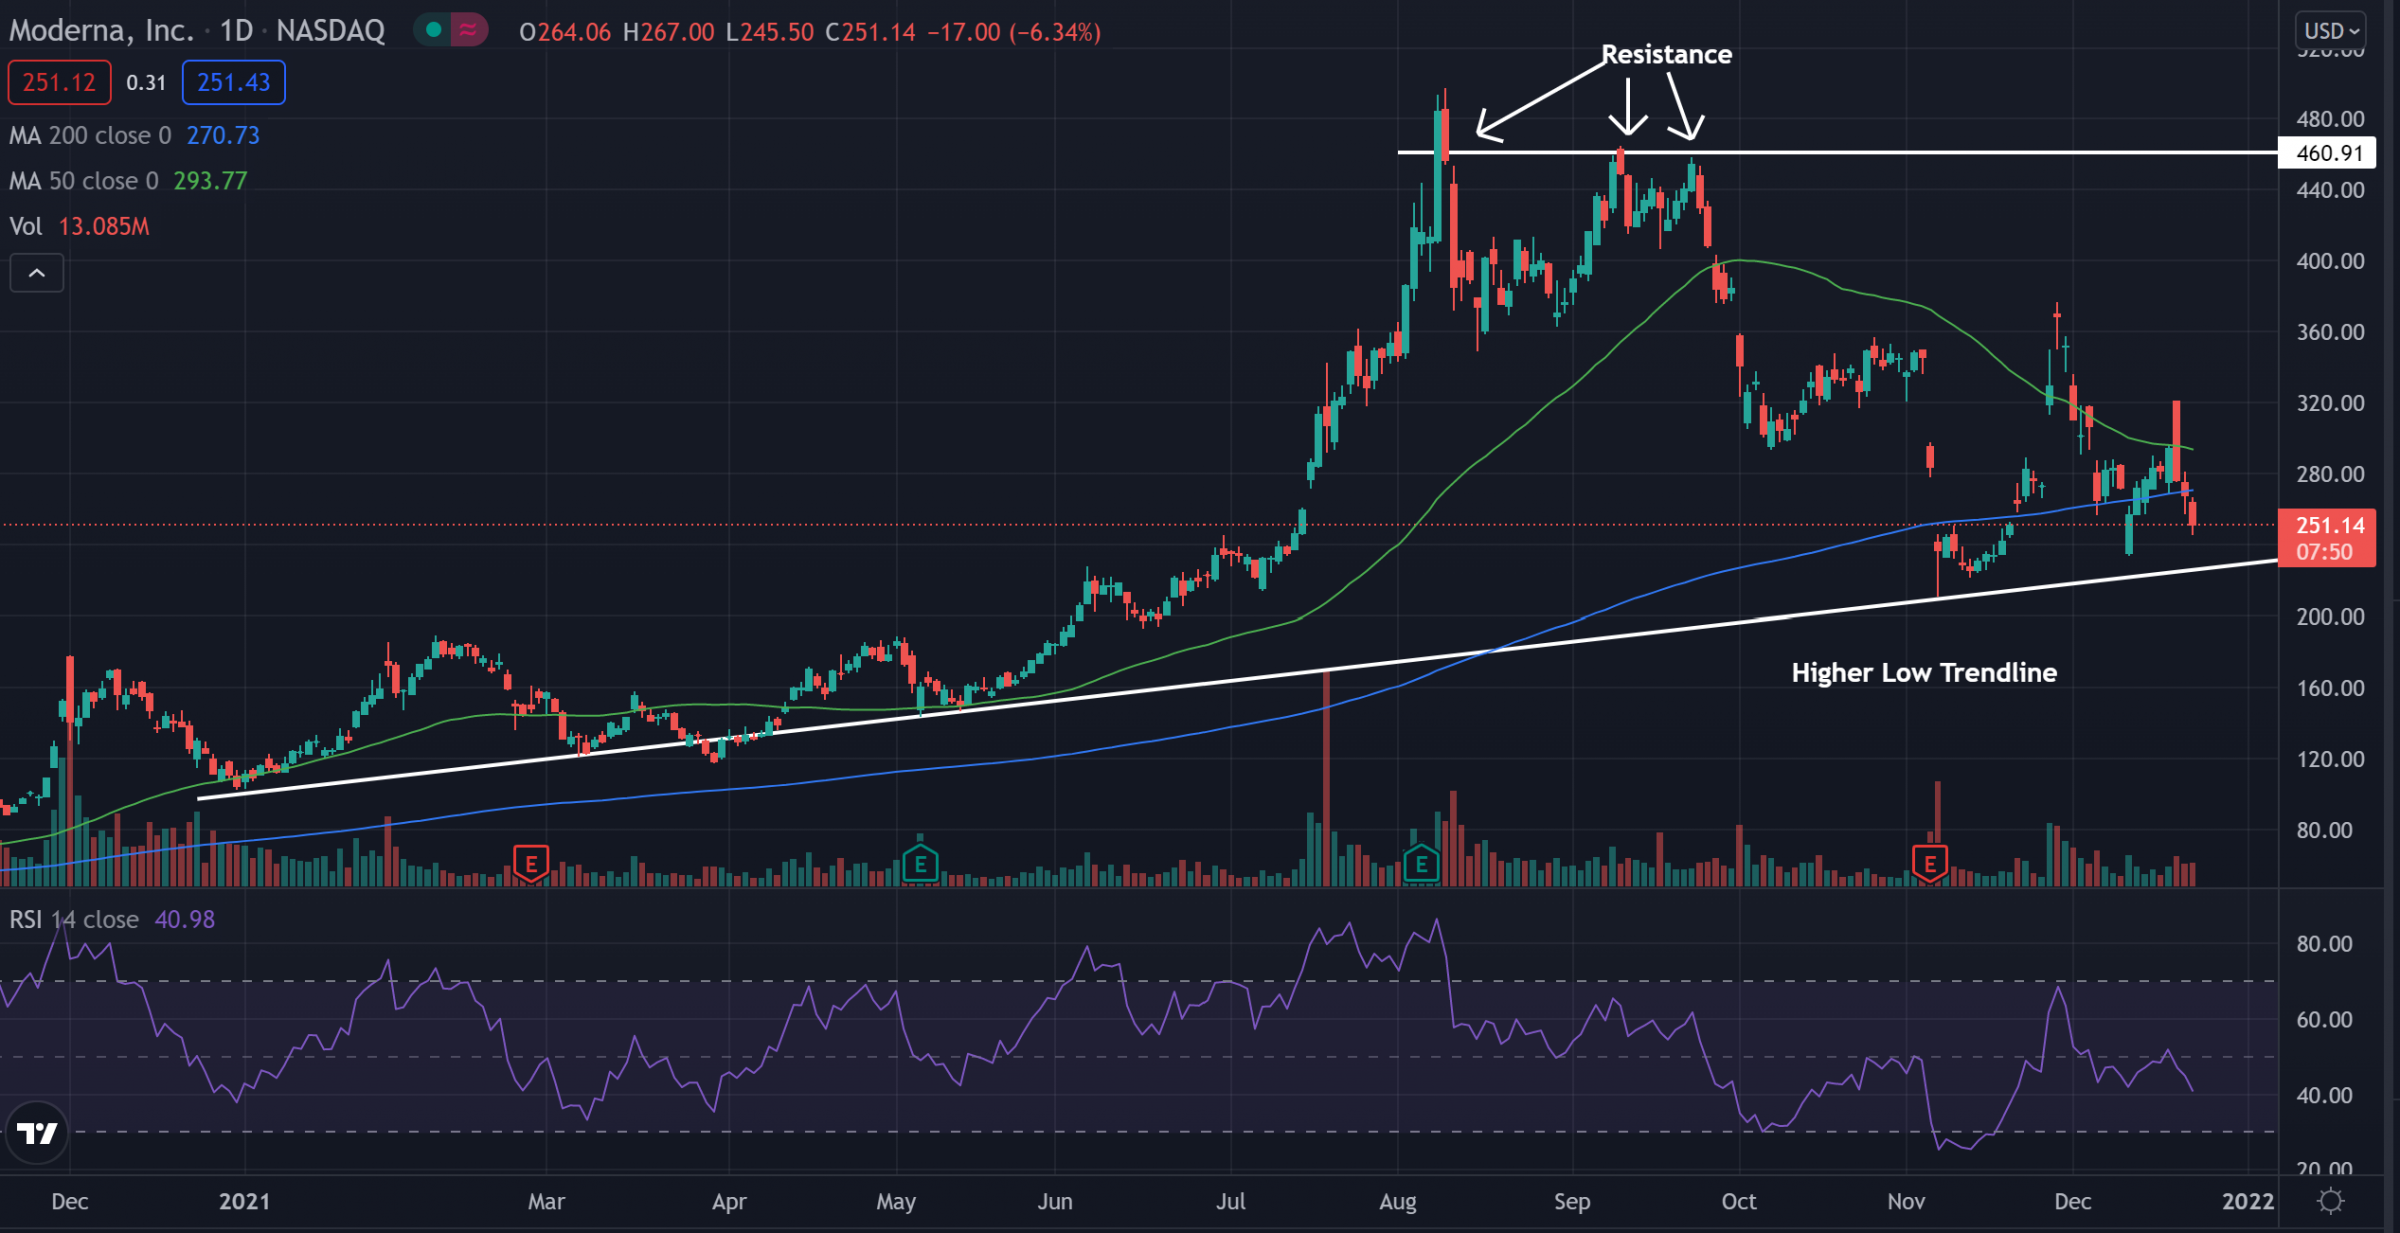
Moderna Inc shares are trading lower Wednesday and are falling toward a support level.
The stock was trending on social media sites throughout the day after the stock saw some movement.
Moderna was down 6.26% at $251.36 at market close Wednesday.
Moderna Daily Chart Analysis
- Shares dipped toward support in what traders call an ascending triangle pattern. Shares could see another bounce off the higher low support at some point in the future. Resistance is shown to be near the $460 level.
- The stock trades below the 50-day moving average (green) but above the 200-day moving average (blue). This indicates the stock is likely in a consolidation period, and the 50-day moving average may act as resistance while the 200-day moving average may hold as support.
- The Relative Strength Index (RSI) has been creeping lower the past few days and sits at 41. This shows that sellers are prevailing in the stock and are slightly overpowering buyers.
What’s Next For Moderna?
Moderna has seen a dip the past few days and is falling back toward the higher low trendline. If this area can see a bounce again the price may start to head toward resistance once again. Bulls are looking for higher lows to continue to form for the stock to keep the bullish trend. Bears are looking to see the stock fall below this trendline and for the price to start moving with lower highs.


