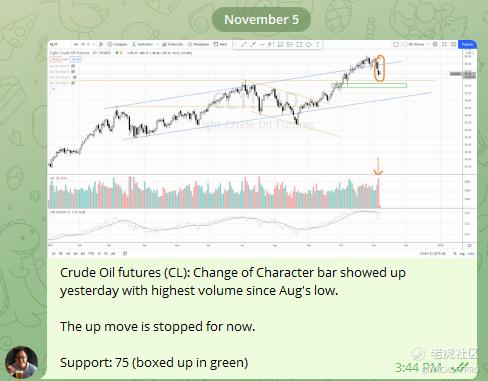
I have mentioned on 5 Nov 2021 that a change of character bar showed up in $WTI原油主连 2201(CLmain)$ (as circled) on 4 Nov and the up move is stopped for now with the immediate support around 75, as shown in the screenshot of my Telegram Group below:
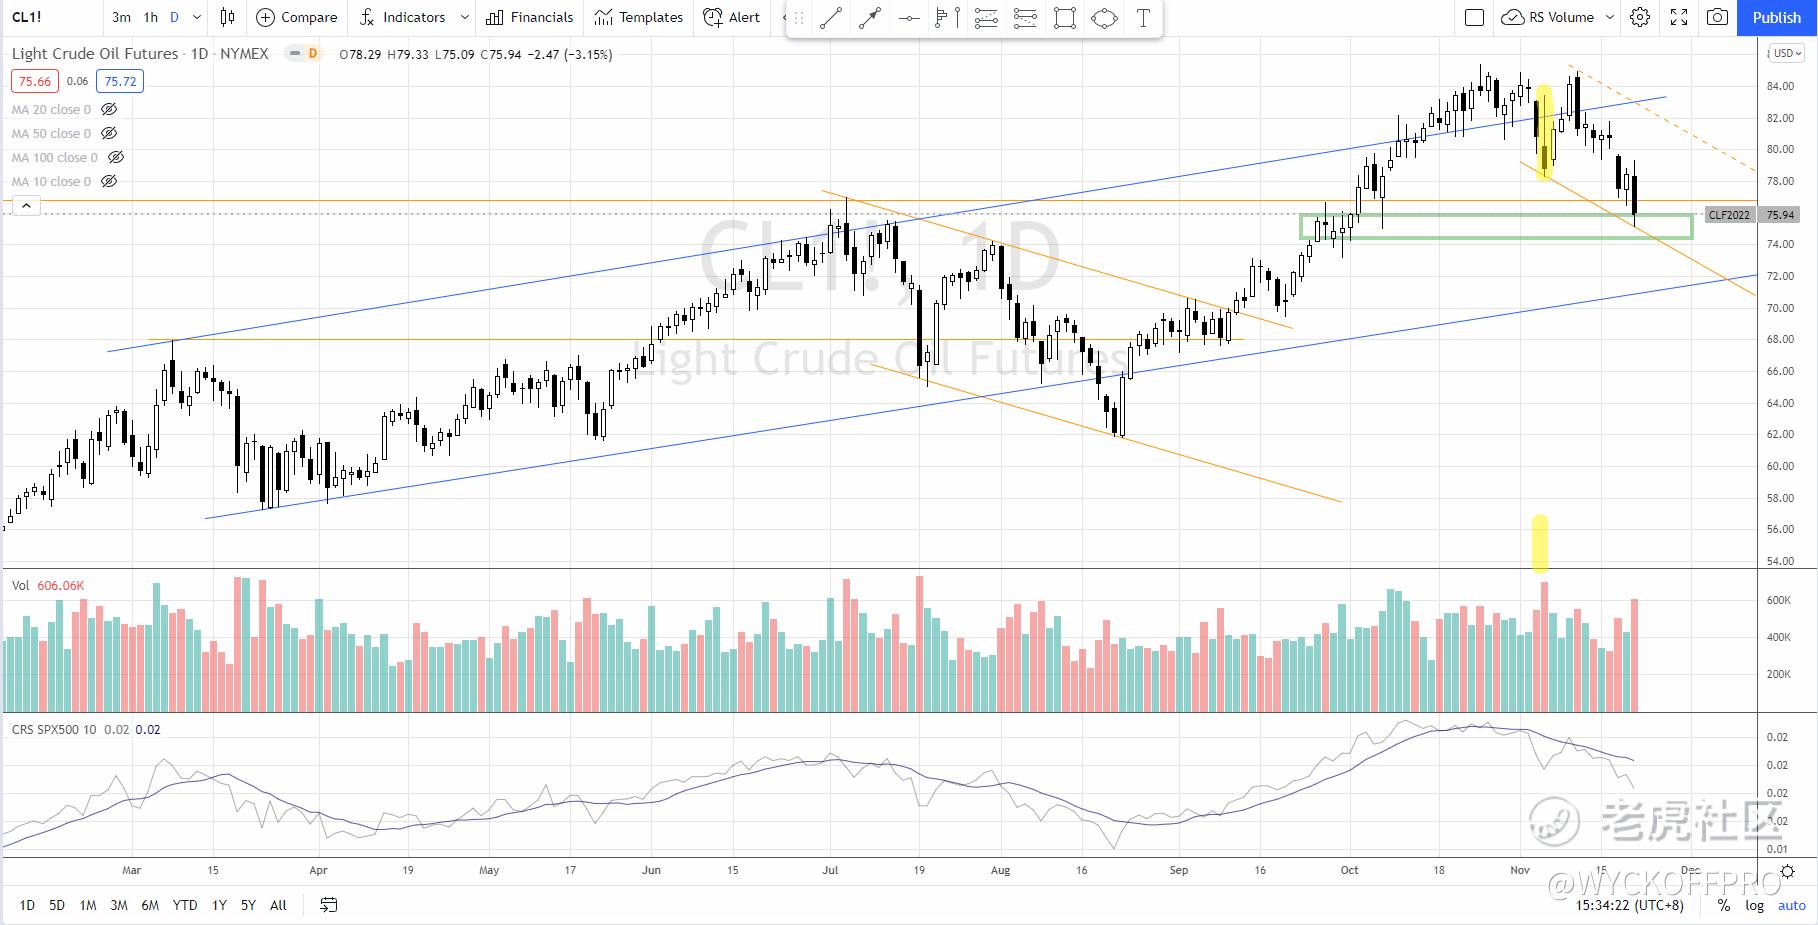
Since then, crude oil had a test of the supply zone followed by a reversal and a reaction. Last Friday, it was testing the support zone (as boxed up in green) near 75, as shown below:
Now, let’s take alook at charts of Oil Services ETF (OIH) and Oil & Gas Exploration & Production ETF (XOP) as a representation of a basket of the crude oil related stocks below, where I have highlighted the bar on 4 Nov in yellow because this is where the change of character bar showed up in the crude oil chart:
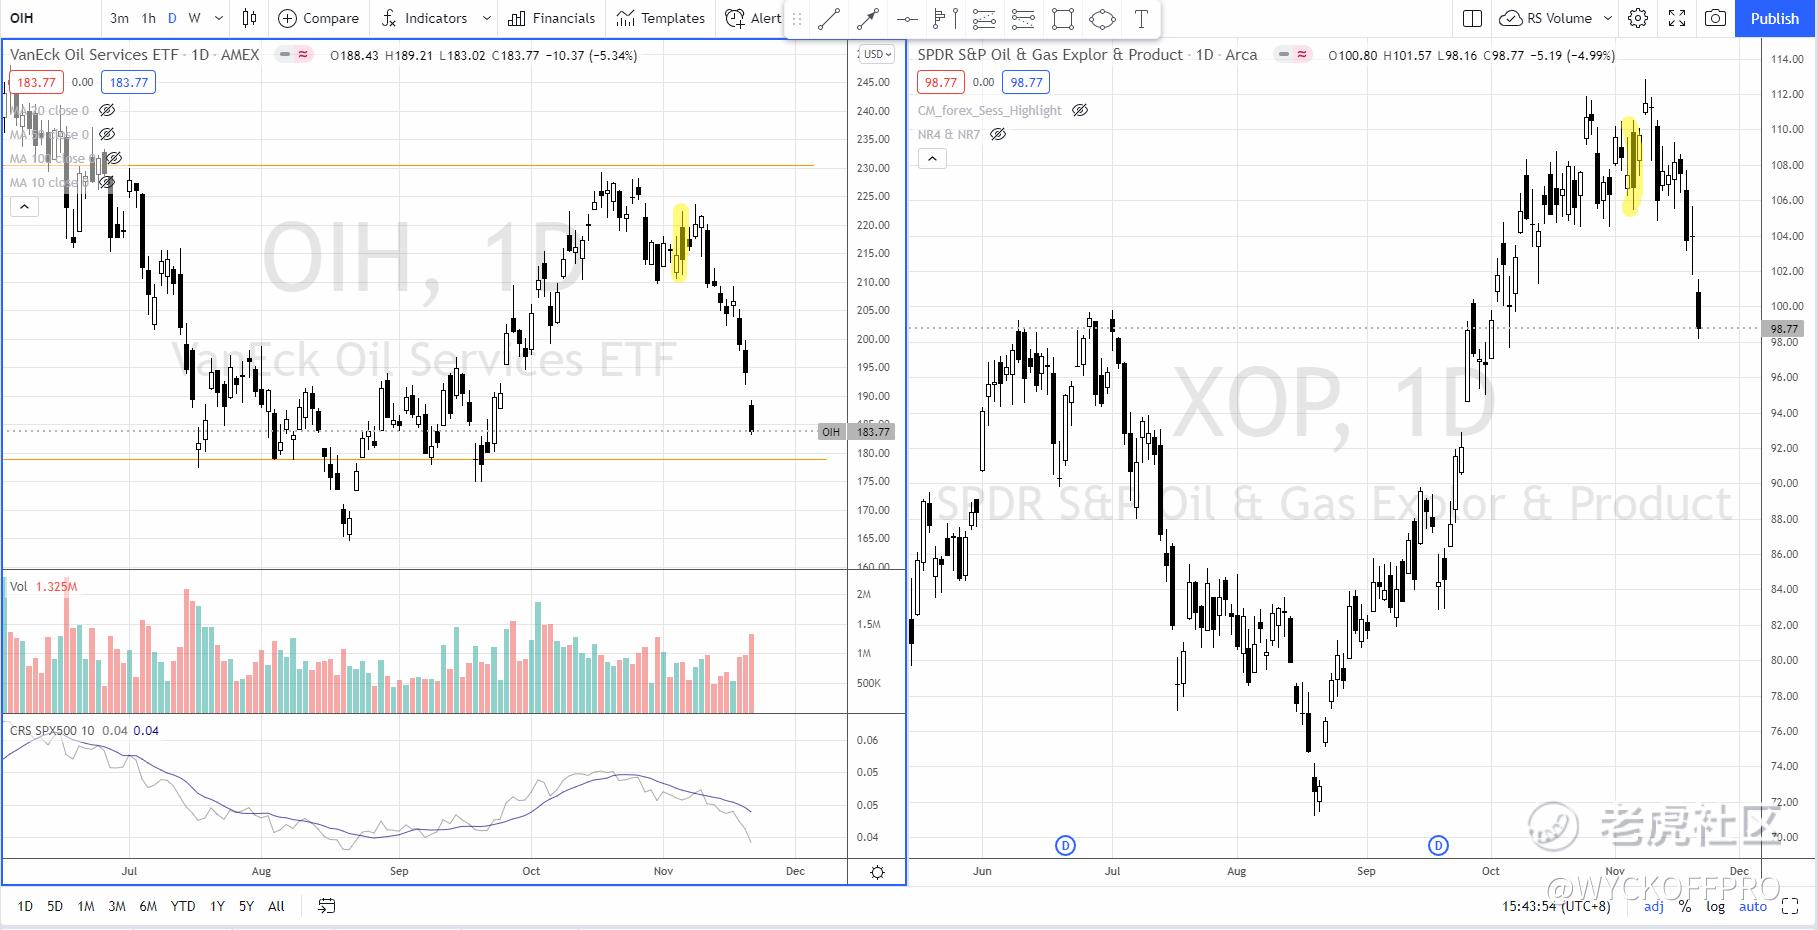
Since 4 Nov, both $石油服务ETF(OIH)$ and $油气开采指数ETF-SPDR S&P(XOP)$ have broken below the support and on a sharp down move. This is not unexpected since these two ETFs are closely correlated with the crude oil performance.
Seasonality of Crude Oil
From the seasonality of the crude oil chart based on 21 years of data as shown below, it is clear to note that in general, crude oil tends to start a downtrend in end of Oct until Dec where Oct, Nov and Dec are the worst 3 continuous months in terms of average return by month.
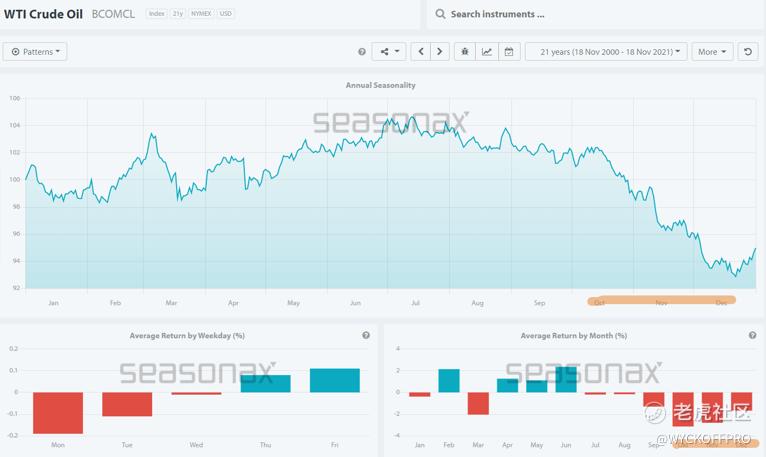
Does that mean the current downtrend in crude oil will last until December at least?
Not necessary. Ultimately, we still need to interpret the current chart of the crude oil.
Crude Oil Analogue comparison
As shown in the daily chart below, crude oil is still in a well-established up channel.
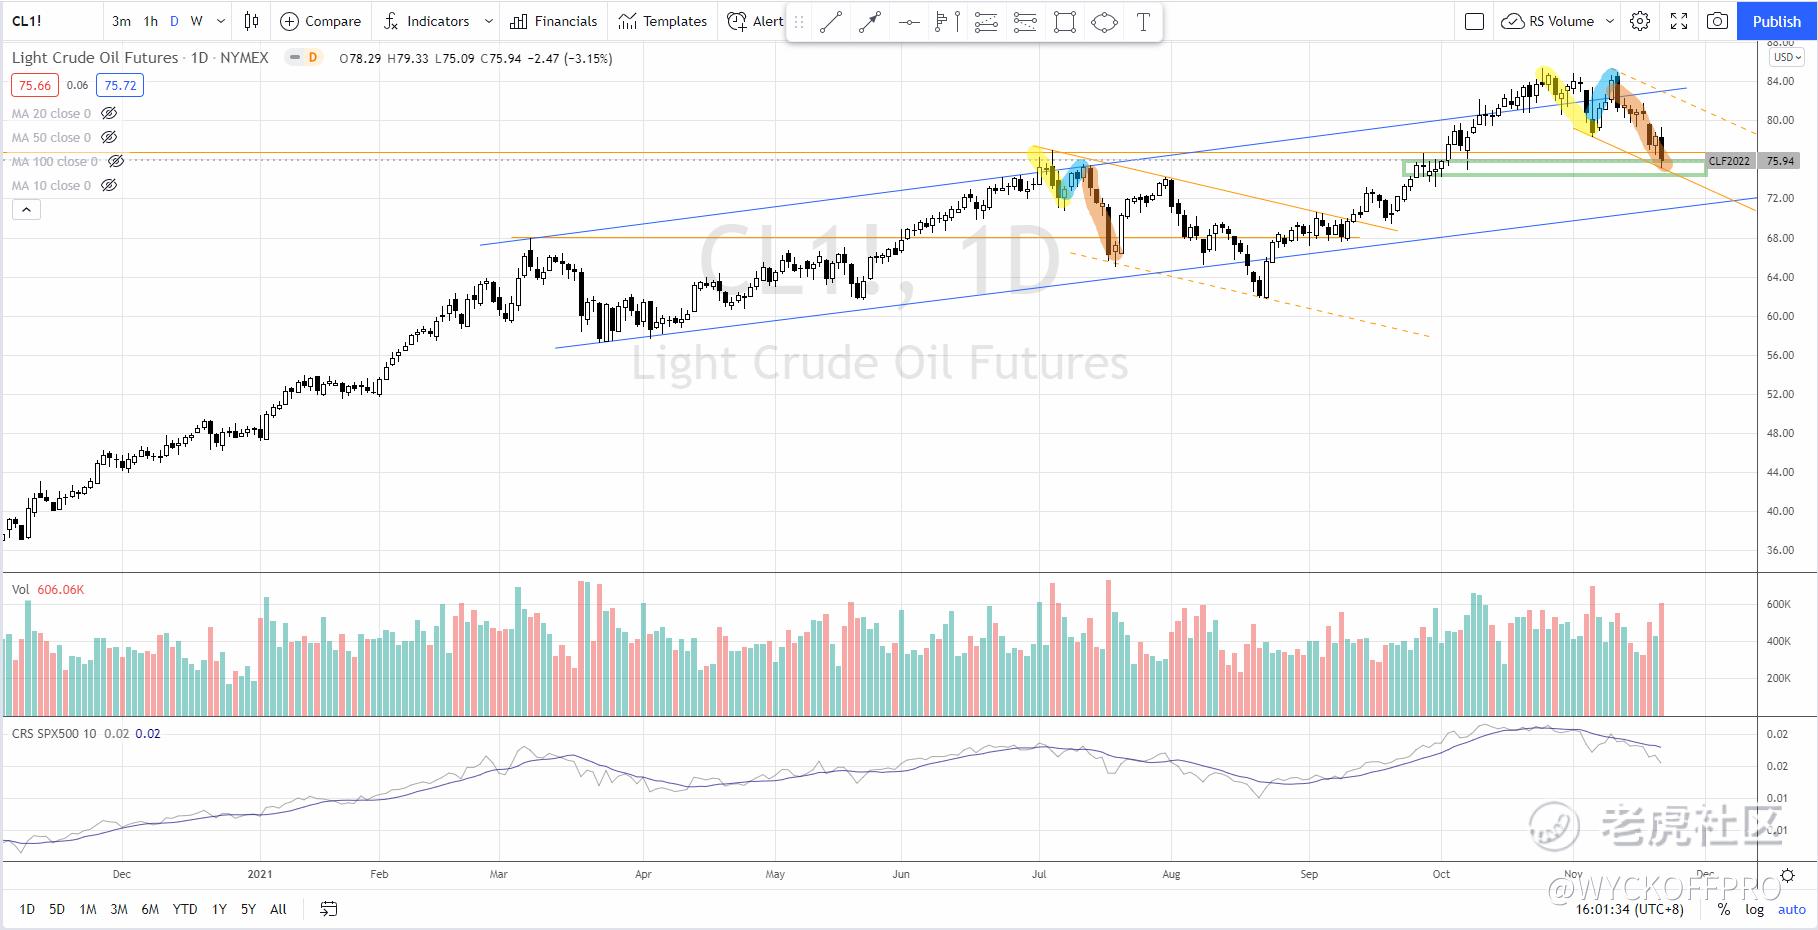
In July 2021, crude oil rallied into the overbought line of the channel and had a a-b-c reaction started a short-term downtrend until Sep 2021.
As the current correction is still unfolding in the crude oil, there is similarity of the current correction compared to Jul’s, where I have highlighted using 3 different colors.
Last Friday’s bar hit the support area near 75 and is in an oversold condition, we might expect crude oil to have a rally to test the axis line near 80 before resumption of the downward movement.
Should the support area near 75 fail to hold, we can expect a test of 72 where the demand line of the channel could provide support. Most importantly, we will need to judge the character of the price movement together with the volume to anticipate the up-coming movement for the crude oil.
In terms of the volume, it is still considered as non-threatening hence I believe this could be still a normal pullback within an uptrend for crude oil.
Let’s be patient and pay close attention to how the price interacts at the key level so that we can plan accordingly.
Safe trading. If you are day trading the US futures or swing trading for Malaysia and US stocks, do check out my YouTube Channel: Ming Jong Tey for additional videos and resources. @Tiger Stars $苹果(AAPL)$ $英伟达(NVDA)$ $百度(BIDU)$
Further Reading
The Perfect Time to Invest in Gold
The Most Important Trading and Investing Rule You Need to Know
精彩评论