各位好! 如果你有某种内容想要我写,可以留下留言。
如果你学到新知识或思维有所改变,可以给我点赞,好评或在你的朋友圈分享给其他人阅读这篇文章。多谢支持!

This is a sharing on Wyckoff Distribution to theoretically explain the FOMO and FUD trends in Bitcoin’s price.
1. Wyckoff Distribution Theory
I came across this phenomenon called the Wyckoff Distribution, which literally blows my head off after I read more about this.
Click here to read more about the theory created by Richard Wyckoff.
https://school.stockcharts.com/doku.php?id=market_analysis%3Athe_wyckoff_method
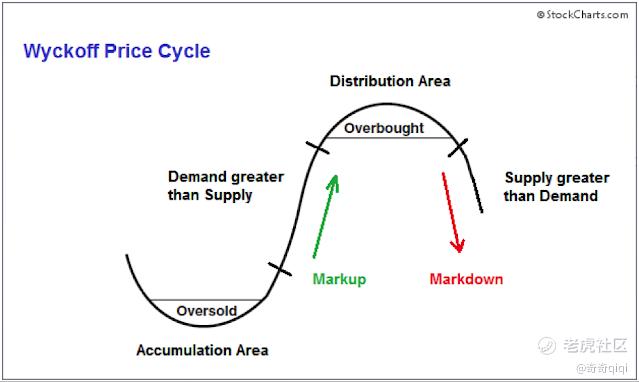
This is geared more towards technical analysis and the psychology of prices in the market. Wyckoff Distribution was created to educate uninformed investors like you and I to reduce the chances of losing such money in the stock market. It uses a 4 stages model to explain the rise and drop in asset prices as shown.
2. Price Crash in May 2021
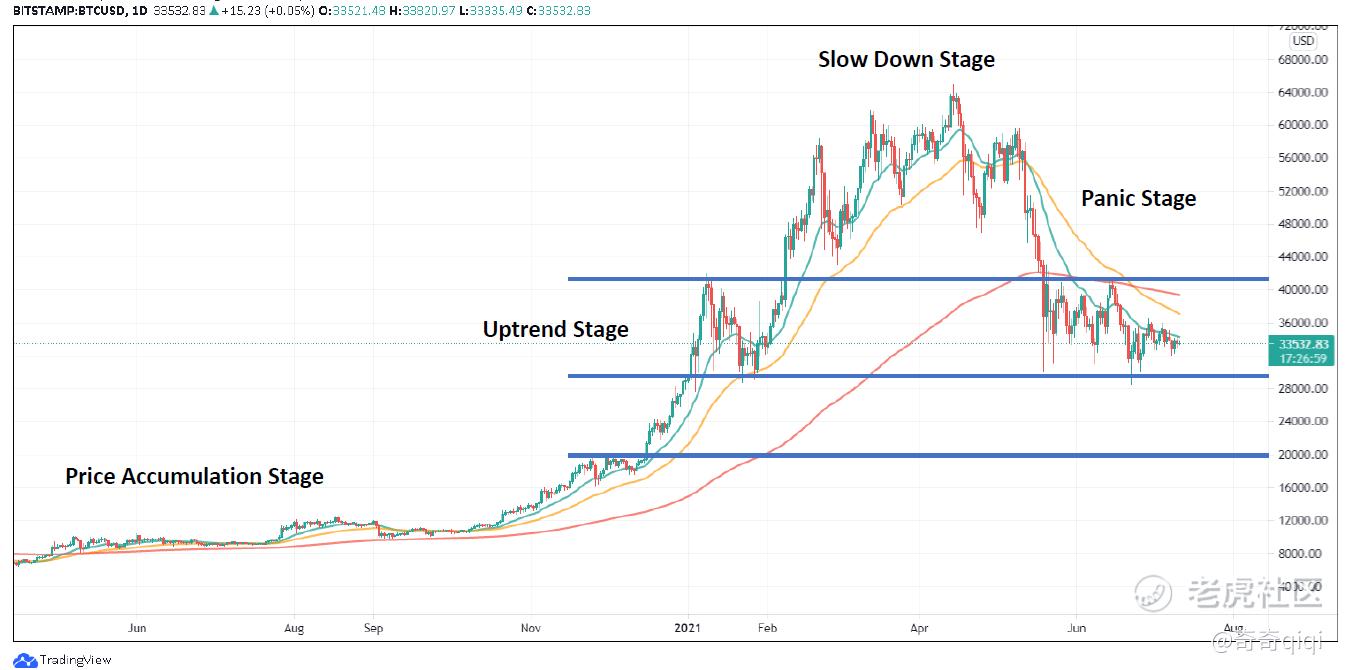
The recent cryptocurrency market crashed that occurred recently in May 2021 might not be a coincidence, as shown in the chart below. We can use Wyckoff to theoretically explain why such a scenario could actually happen in real life.
It makes sense on how the supply of Bitcoin (BTC) might be manipulated so that a certain group (eg. the whales 🐳) who were more informed, strategic and powerful could deceive those who were less informed by playing their cards to raise and drop the price of Bitcoin (BTC) in a short span of time to create a ‘Fear Of Missing Out’ (FOMO) and ‘Fear, Uncertainty and Doubt’ effects.
I believe that among your circle of friends, there would be someone talking about Bitcoin. Even people who usually do not invest would just jump in and open an account to buy some BTC etc, which was unthinkable.
This was a plan to rip-off the maximum amount of money possible from us, normal retail investors who are invested in cryptocurrencies.
Of course, we must not forget that during this period of time, there were other media factors contributing to the surge in prices, such as Tesla buying into bitcoin, Elon Musk constant twitting about Bitcoin and Doge coins, and other institutions such as Square and Paypal also announced to enter into the cryptocurrency space.
All this news and media created an enormous amount of ‘Hype’ and ‘FOMO.’ There was so much media coverage out there predicting BTC prices going up to 50K USD and even 100K USD to the moon 🚀🌙 etc.
I still remembered that it was common for certain days to see BTC prices going up or down by 3000 USD to 5000 USD, and that was the norm at the period of time.
This is unlike now in the period of June / July 2021, where BTC price fluctuation has clearly slowed down from those days.
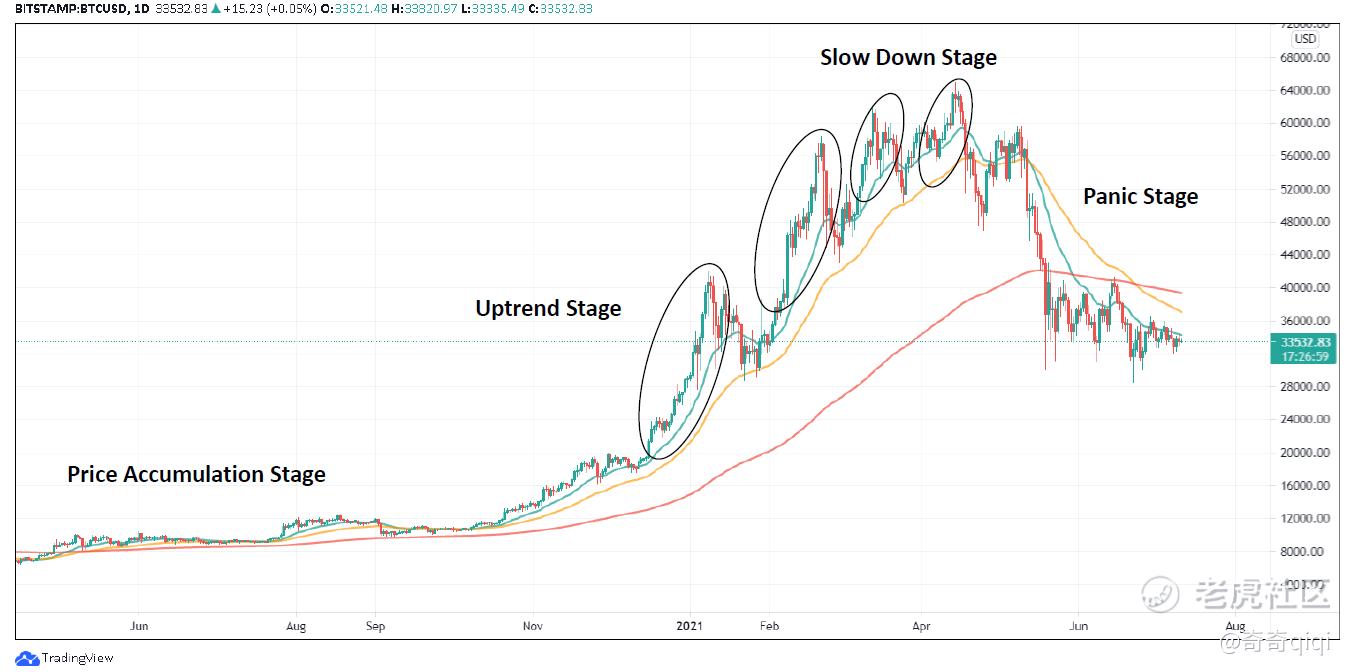
In the chart for the entire year of 2020, Bitcoin (BTC) and other cryptocurrency prices were in the ‘Accumulation Stage’ where prices were increasing and decreasing at a constant steady-state (small fluctuation) with little abnormality in price movements.
However in early December 2020, with the hype building up, BTC price started to surge up quickly and a price breakthrough above the resistance level occurred at the 20k USD price level.
There were a total of 5 peaks that occurred as seen in the chart and the last peak started to lose momentum before panic selling and profit-taking took place quickly. The price of BTC and other cryptocurrencies started to crash down like an avalanche and that brought us to where the price currently is hovering today, back to the ‘Accumulation Stage’ of the Wyckoff Distribution.
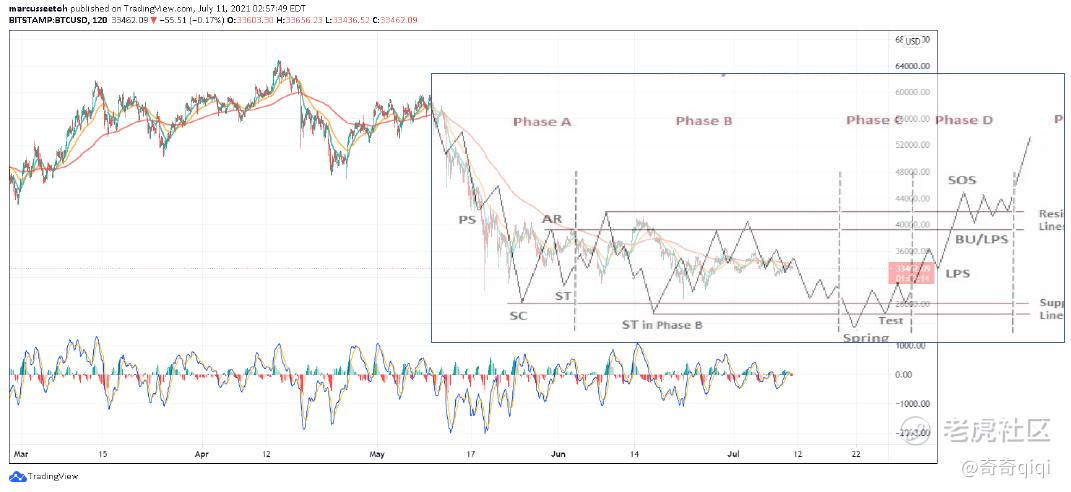
3. Wyckoff Distribution with BTC Price Chart Overlay
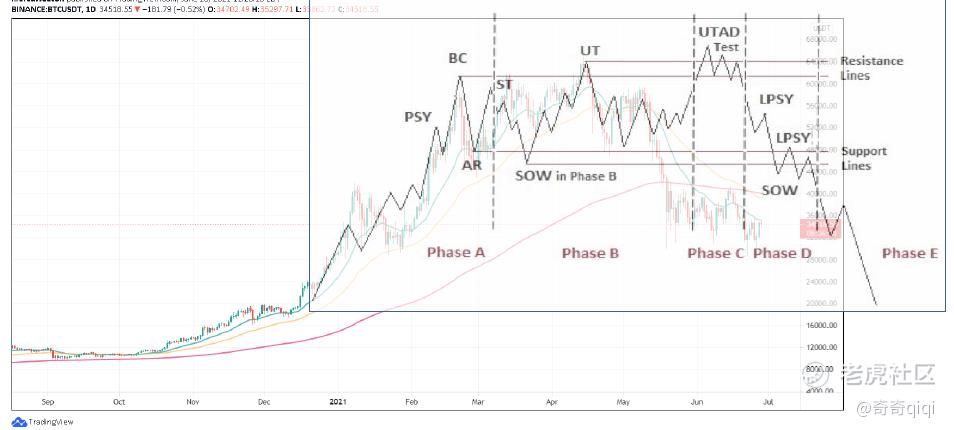
Here I attempted to overlay the Wyckoff distribution over the 1 year BTC price chart as shown below.
Furthermore, the BTC price 20 days (green colour line) and 50 days (yellow colour line) Exponential Moving Average (EMA) is moving below the 200 days (red colour line) EMA line indicating bearish patterns at this moment of time.
Phases A, B, D, and E of the Wyckoff Distribution chart fall nicely on top of the BTC price chart.
Only Phase C was not aligned and slightly off as mentioned that the Wyckoff is atheoretical distributionto explain the drop in BTC price in May 2021 and also depending on the time frame you use to do the overlay.
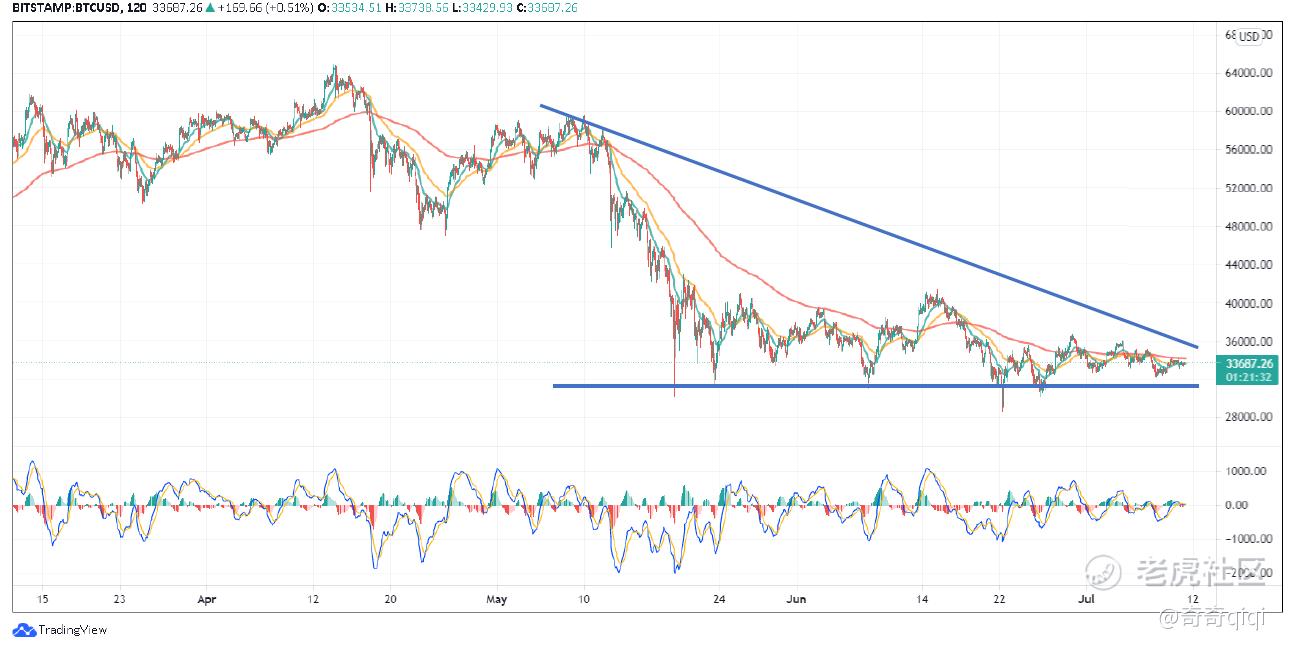
4. What Happens Next
We know that the price of BTC has fallen, and it has gone back to the “Accumulation Stage” of the Wyckoff Distribution. It will take some time for people, in general, to forget about this crash, to regroup and gain back their confidence to invest in Cryptocurrency.
Here I show the overlay of the Wyckoff Distribution right after the panic/profit sell-off period using the 1 year BTC price chart as well.
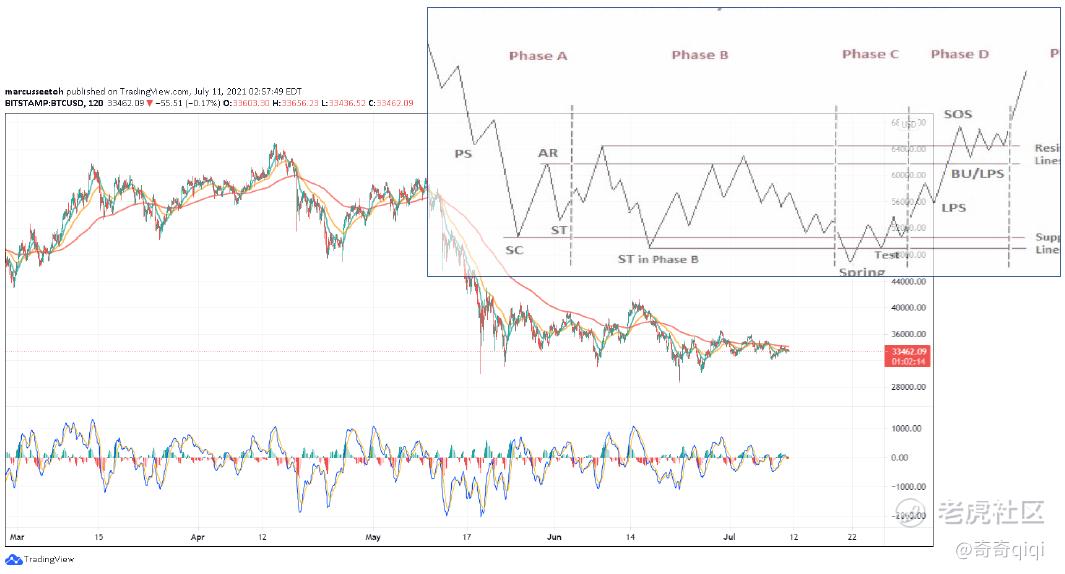
You can clearly see that prices will remain at this range for a long while before we start to see some form of ‘uptrend stage’ like the one that we experienced at the beginning of this year.
Lastly, you can see from May 2021 to 11 July 2021, the movement of BTC’s price has slowed down in momentum.
5. Takeaways
Having the ability to identify at which stage (either 1, 2, 3, or 4) of the Wyckoff Distribution is that particular stock or cryptocurrency you are planning to place an order is currently at.
Once you have identified, you will be able to make the necessary decision accordingly to wait or enter depending on multiple factors that are in play. Don’t FOMO to buy into something when the price suddenly shoots to the moon.
From the chart, it’s clear that the price will always go up and down in this wave-like pattern. The same pattern repeated several times during this period. If you have missed the first wave’s peak price, there is bound to be a second wave peak or even a 3rd wave peak coming soon.
Do not have to rush in to buy the stock/crypto at the highest peak with the mindset that ‘I have to get in to go to the moon now’ 🚀🌙, it’s now or never that the price will blast off and it’s not coming down to the low levels again.
Prices as steep as what you have seen at the beginning of the year for Bitcoin will surely come down somewhere in the future when some people start to exit their positions to take profits or those who panicked and sell off their positions.
After which, that is the appropriate time to go in and scoop up some BTC coins at discounted prices.
I took reference from this person’s work. Feel free to click on his video and listen to his detailed explanation of the Wyckoff Distribution.Watch it here: https://www.youtube.com/watch?v=Lhf_2gJJS1I
Disclaimer: All information stated here is only for illustration and educational purposes. It’s not financial advice to buy or sell any financial products. Please perform your own due diligence before investing, as always.
Originally published at https://medium.com/the-capital/to-explain-bitcoins-2021-bubble-burst-with-wyckoff-distribution-4cc9b4329244?sk=4080bf705d13385c503981a087ddeff6
@Tiger Stars Stars $ProShares Bitcoin Strategy ETF(BITO)$ $Marathon Digital Holdings Inc(MARA)$
精彩评论