Keeping a close tab on your company’s unit economics is one of the most important task for management and the board as it tells a lot of story on how the company is performing over time.
Today, we’ll be focusing on one of the most commonly over-used and over-reported metrics by many companies – Monthly Active Users (MAU) / Daily Active Users (DAU).
How The Significance of MAU/DAU Came About:
MAU (or some may track on the daily DAU) became increasingly popular largely when companies such as Twitter and Facebook started tracking and reporting engagement rates and growth projections. These businesses are social media networks which rely on social media engagement and activities, which includes advertising to make money so it makes sense for these companies to track the monthly or daily users actively.
However, these metrics are lesser relevant to a certain extent to companies whose business nature does not depend on user engagement. For instance, you might log into Facebook 6 times a day spending 4-5 hours each time on news that you read or friend’s updates that you care about. But for companies who are in the e-commerce business for instance, you don’t typically get users to buy in every few hours. The typical lifetime cycle of a user is to buy about 4x a month, or once a week. User may log in a few times a month, which increases the MAU and hourly rate they spend but they still convert about 4x a month.
This is my typical life cycle as an e-commerce buyer when I am trying to buy stuff in Lazada or Shopee.
First, I log into both platforms looking for the product I want.
Next, I compare the two prices and check out which is cheaper (product must be the same quality for comparison purpose). I also took consideration the review of the sellers to make sure there’s no big concern to take note of.
Lastly, I check out any store promotions or platform promotions to gauge who is giving out more promo discounts (for instance, Lazada 12.12 has Bonus $6 for every $60 spent while Shopee 12.12 has lower threshold of buy any 2 products within the same store for $3 off).
You can see from this example here that I contributed to both the MAU/DAU for both platforms but my conversion took place in only one out of the two platforms I used.


Companies that are in a travel or seasonal accommodation business are even rarer.
Take Airbnb or Booking for instance.
They are both successful businesses today because of the great and sticky moats they have presented to users.
However, as much as the business would like to see an increase in more user’s engagement, the fact is a typical user travels about 2-3x a year. This means to say that by focusing only on the MAU/DAU metrics alone will be misleading when investors try to understand the company’s progression.
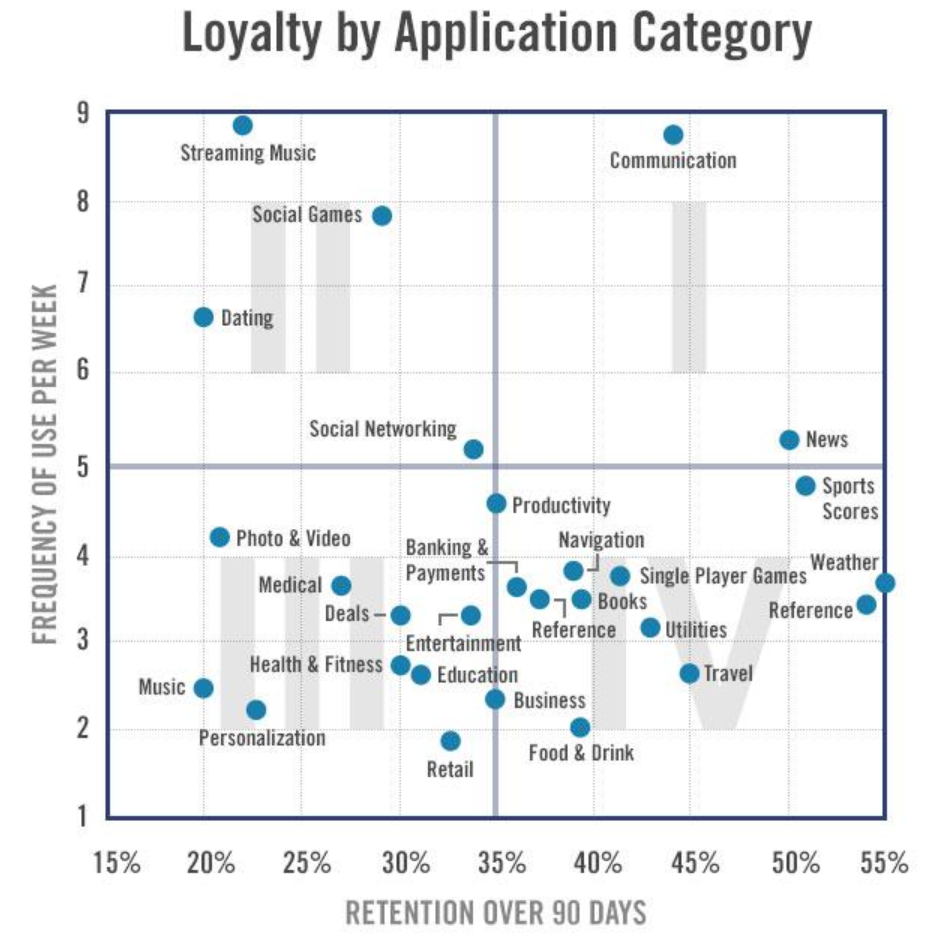
The above appendix shows a matrix across industries between frequency x retention over the course of 90 days.
In this chart, you can see that industries such as Streaming Music, Social Games and Dating earn high frequency of usage but gets very little retention once you lose them.
Communication industry is probably stale and dry but it commands very high usage of frequency and retention (so troublesome to switch your telco providers right!).
For commerce shopping or travel, like we mentioned above, you do not get a lot of usage frequency but once you are in their ecosystem, you will likely keep using them for your next purchase.
Breaking MAU Down Further Into More Specifics:
It is easy to see why looking at MAU alone can be misleading when trying to analyse the company’s growth and progress.
Thus, it is important to further break MAU down into details so we can take a closer look of what components are contributing to it.
Let me illustrate this using an example below.
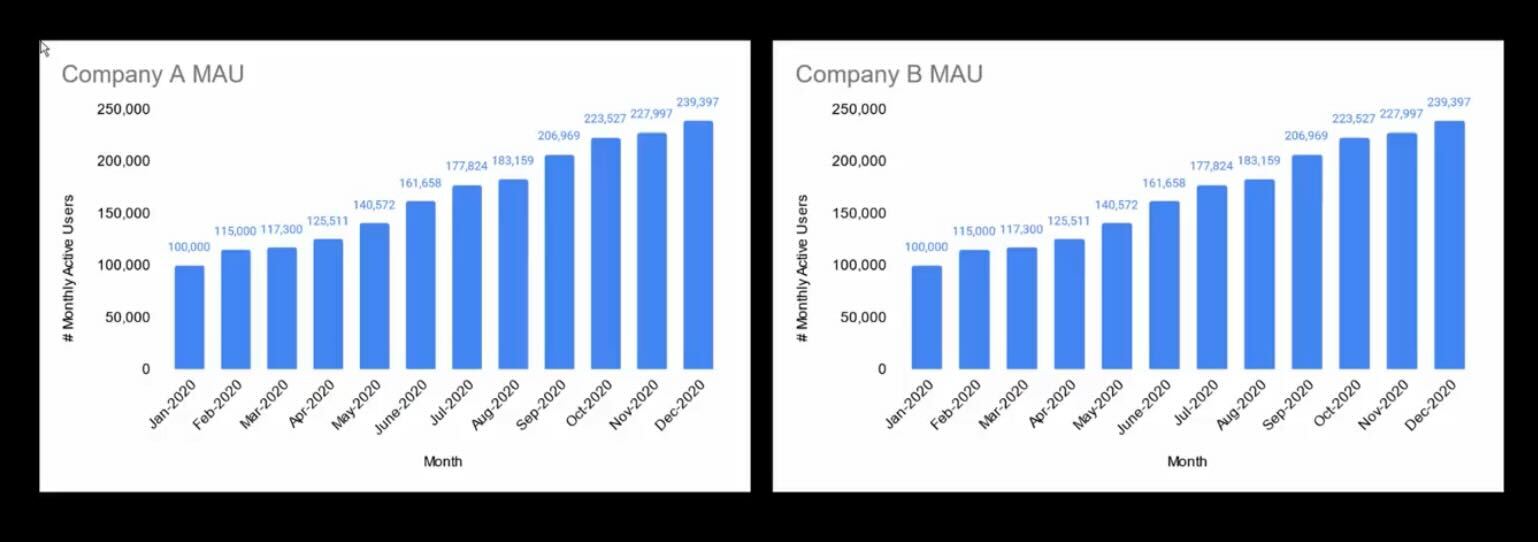
Based on the above, both Company A and B has an impressive growing MAU month on month and it exhibits exactly the same trend from the start of the year to the end.
However, when we break it down further into the proportions of the details, it tells totally a different story.
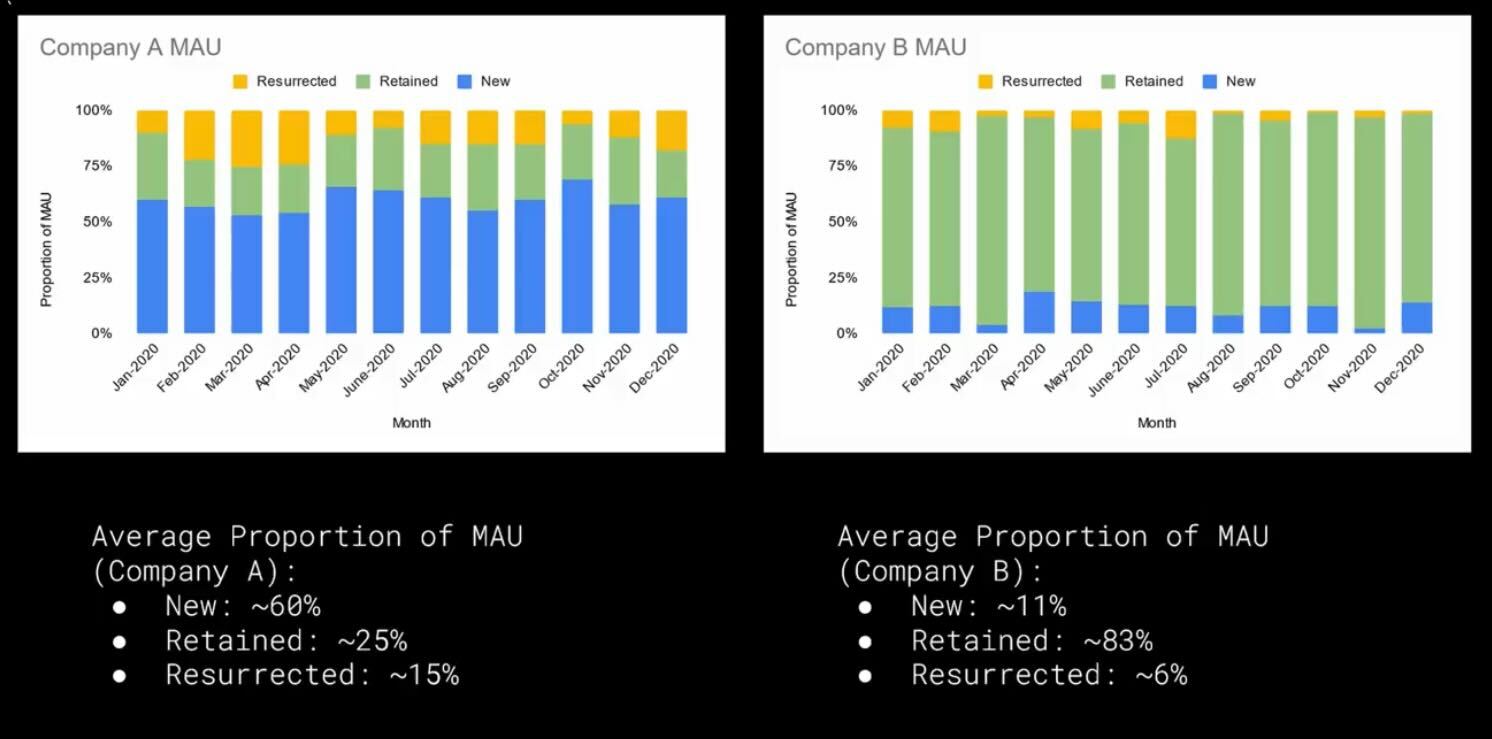
For Company A, the new users made up about 60% of the entire MAU while the company managed to retain 25% of its users and revive or resurrect 15% of the proportion of users who have previously gone inactive.
For Company B, the new users made up about 11% of the entire MAU while the company managed to successfully retained 83% of its users and revive or resurrect just 6% of the proportion of users who have previously gone inactive.
From this, we can better infer that company A is positioning themselves to acquire more new customers while at the same time trying to spend their efforts in trying to resurrect some of their previously “lost” or inactive customers.
For company B, we can infer that the company has a sticky business moat given the amount of retained users it managed to retain but was not very successful or at the near end of their matured business cycle to acquire further new customers.
Many companies will also be concerned at the number of churned rate they incur over the course of time.
A company or product with a high churn rate shows issues pertaining to either the product itself or certain services which the user clearly does not like. This warrants a closer look if the company wants to remain relevant and successful in the industry.

Conclusion:
MAU / DAU is just one of the top funnel awareness and consideration metrics when trying to gauge or project through your run-rate projection across the many more years into the future.
Different companies have different rules to decide what constitutes a definition that would fit into MAU.
For instance, in the company I am currently working at, we measure quality visitors as someone who has spent more than 10 seconds on our platform/website and active visitors a subset of that number + have viewed at least one of the product PDP page.
Other companies may have different rules and engagement they wish to capture based on the relevant industries.
Unfortunately, many companies are today over-reporting and over-emphasizing their MAU numbers without giving specific details into what information are they trying to project or work on. Simply reporting a YoY or QoQ growth on MAU numbers is meaningless as we can already see above that these numbers can churn as fast as they are being acquired, leading to nil outcome at the end of the day.
The next time you look at companies reporting impressive growth on these numbers, you may want to grow a little skeptical especially if that growth does not trickle down into conversion sales number.
精彩评论