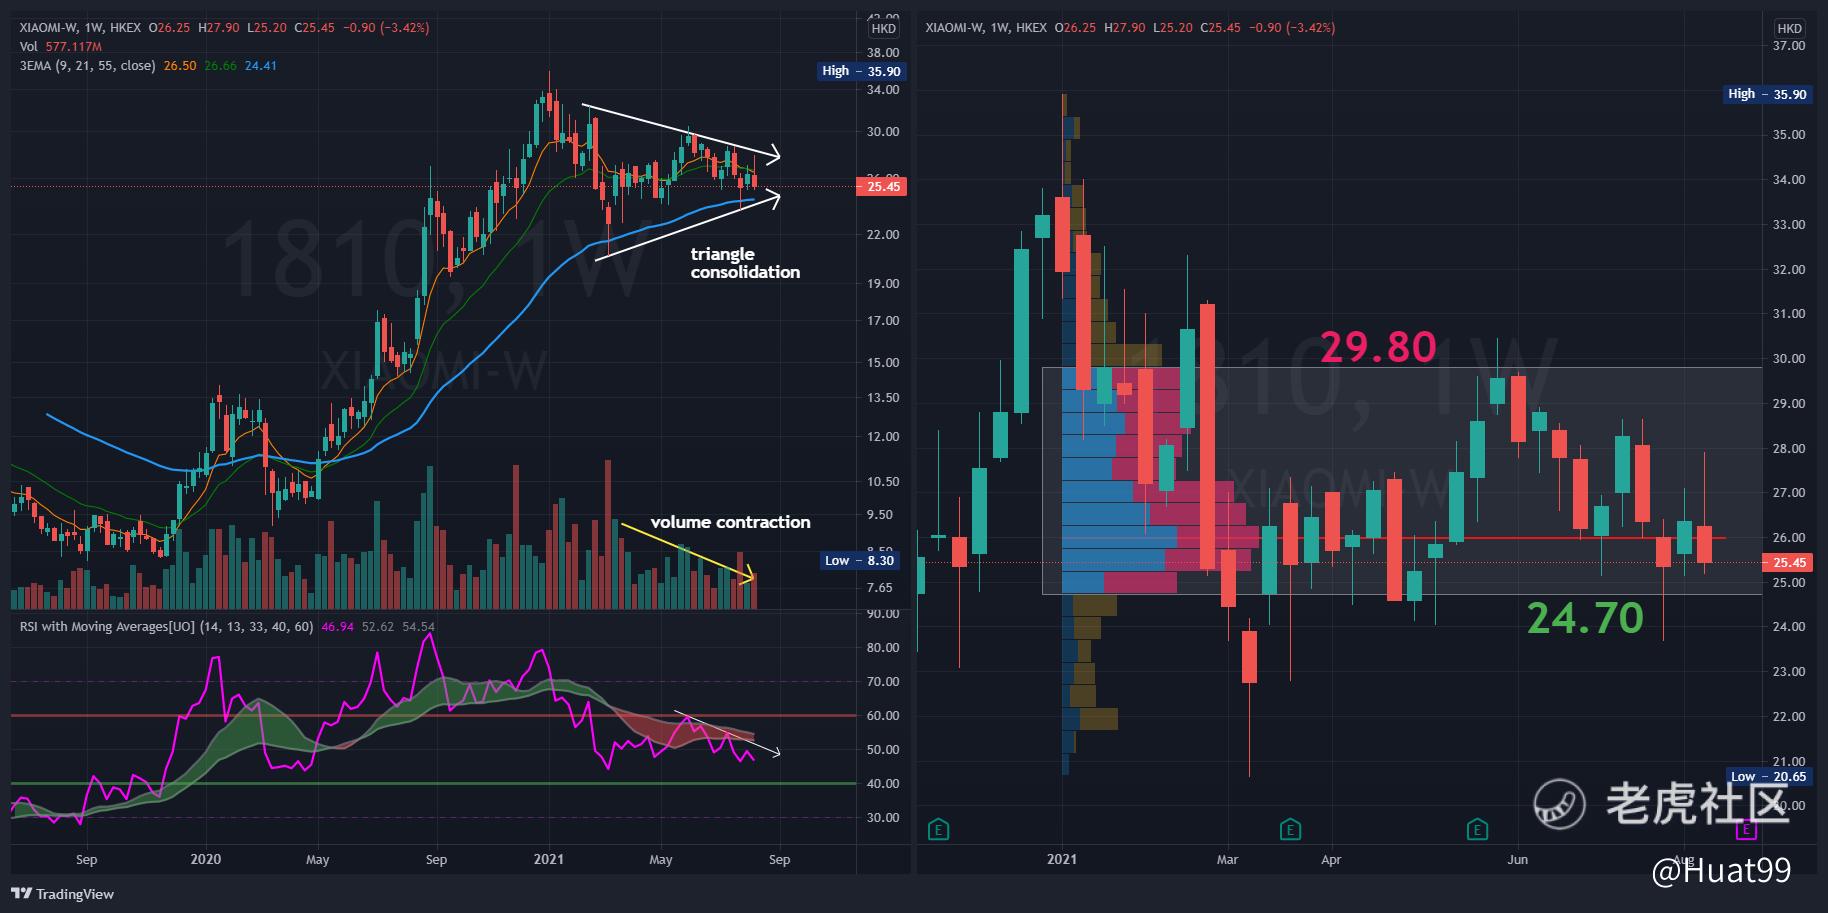
$小米集团-W(01810)$Weekly Chart
1. since Feb 2021, share price has formed a converging triangle consolidation
2. volume contraction over the weeks, typical found in triangle pattern
3. price action mostly trade within 24.70 ~ 29.80 as shown on the right chart
Moving off either range would reveal the next trend of Xiaomi

精彩评论