$蔚来(NIO)$Going down all the way to $20+ ??
Weekly Chart Technical Analysis (side by side comparison)
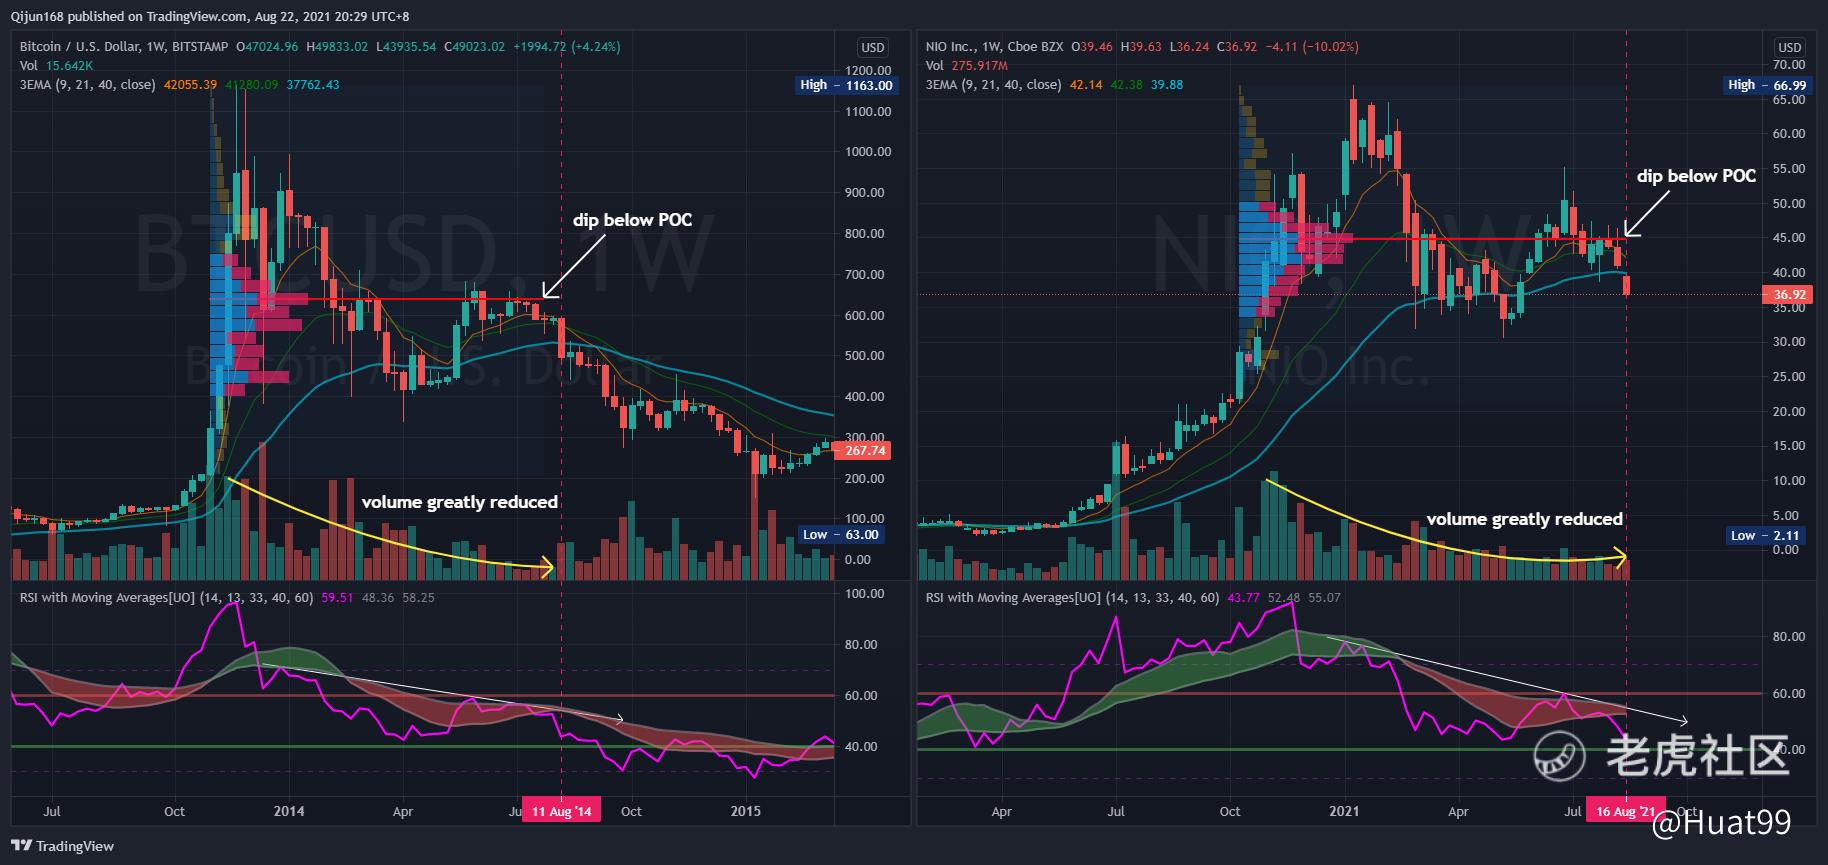
Left - BTC/USD back in 2014 / Right NIO as of current
- back then, Bitcoin dip below POC, gone below 40 week EMA
- thereafter price shed further all the way back to where the Volume Profile measured from
- currently, share price of NIO have since dip below POC, and further gone below 40 week EMA this week
- trading volume greatly reduced even at the second rally back in Jun
This is the 2nd time share price gone below 40 week EMA and it really doesn't looks good
Could further weaken to Low of $30.71 back in May, or even back to $20+ in the worst case.

精彩评论
Now is a sector movement.