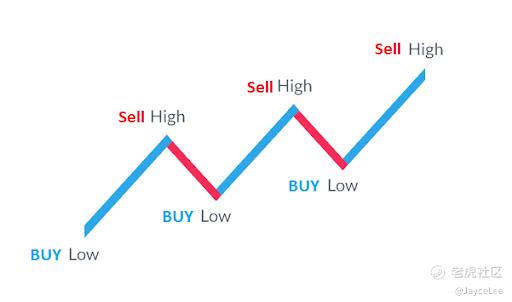
Many people heard of this advice "Buy low, sell high", but how exactly do we achieve that?[疑问]
This post is for long-term investors who believe in DCA(Dollar-Cost Averaging).[开心]
Fundamentals and Trend
First, the stock we pick has to be a fundamentally good company and be on an uptrend from a long-term perspective. Information such as profitability, revenue, assets, liabilities, and growth potential are considered fundamentals.
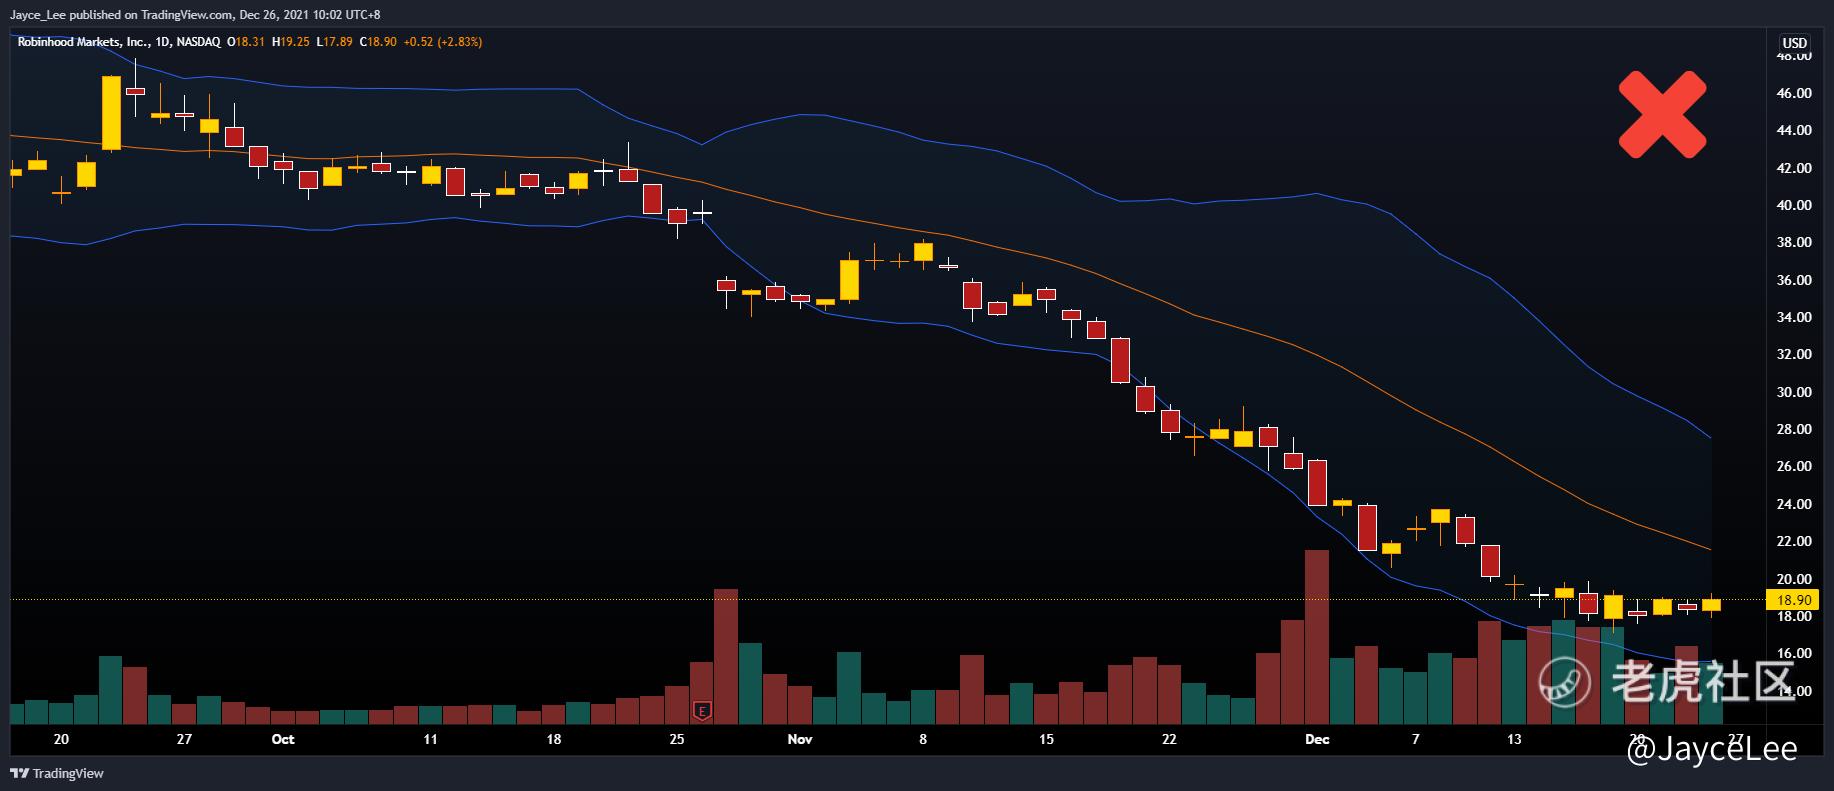
Example of a downtrend(Ref: $Robinhood Markets, Inc.(HOOD)$):
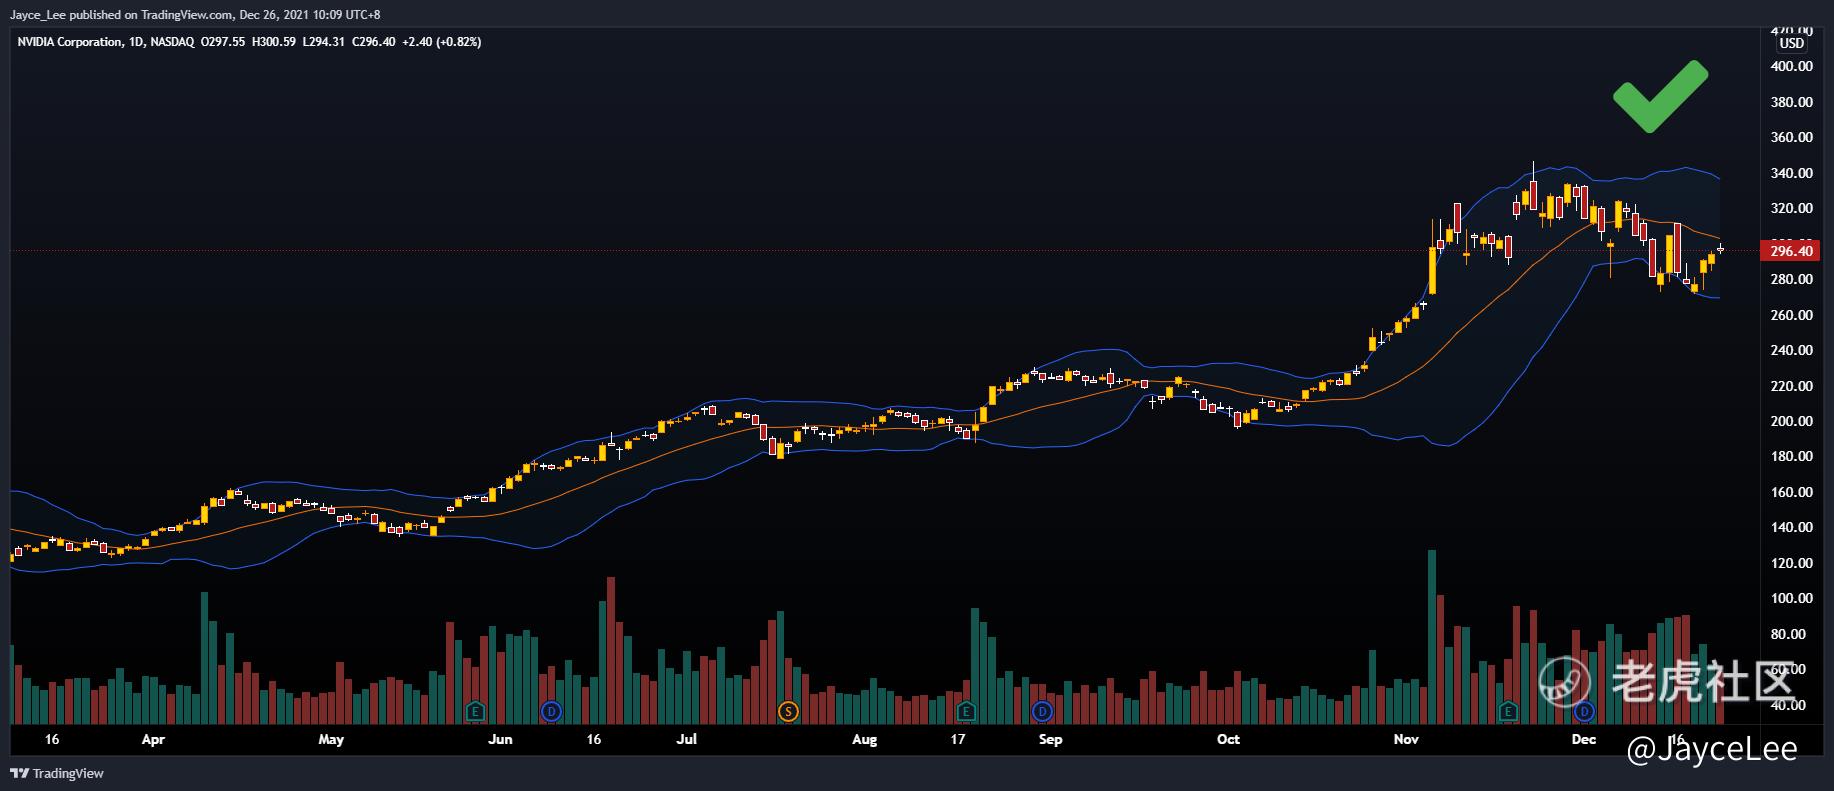
Example of an uptrend(Ref: $英伟达(NVDA)$):
Be Patient with Price Movement
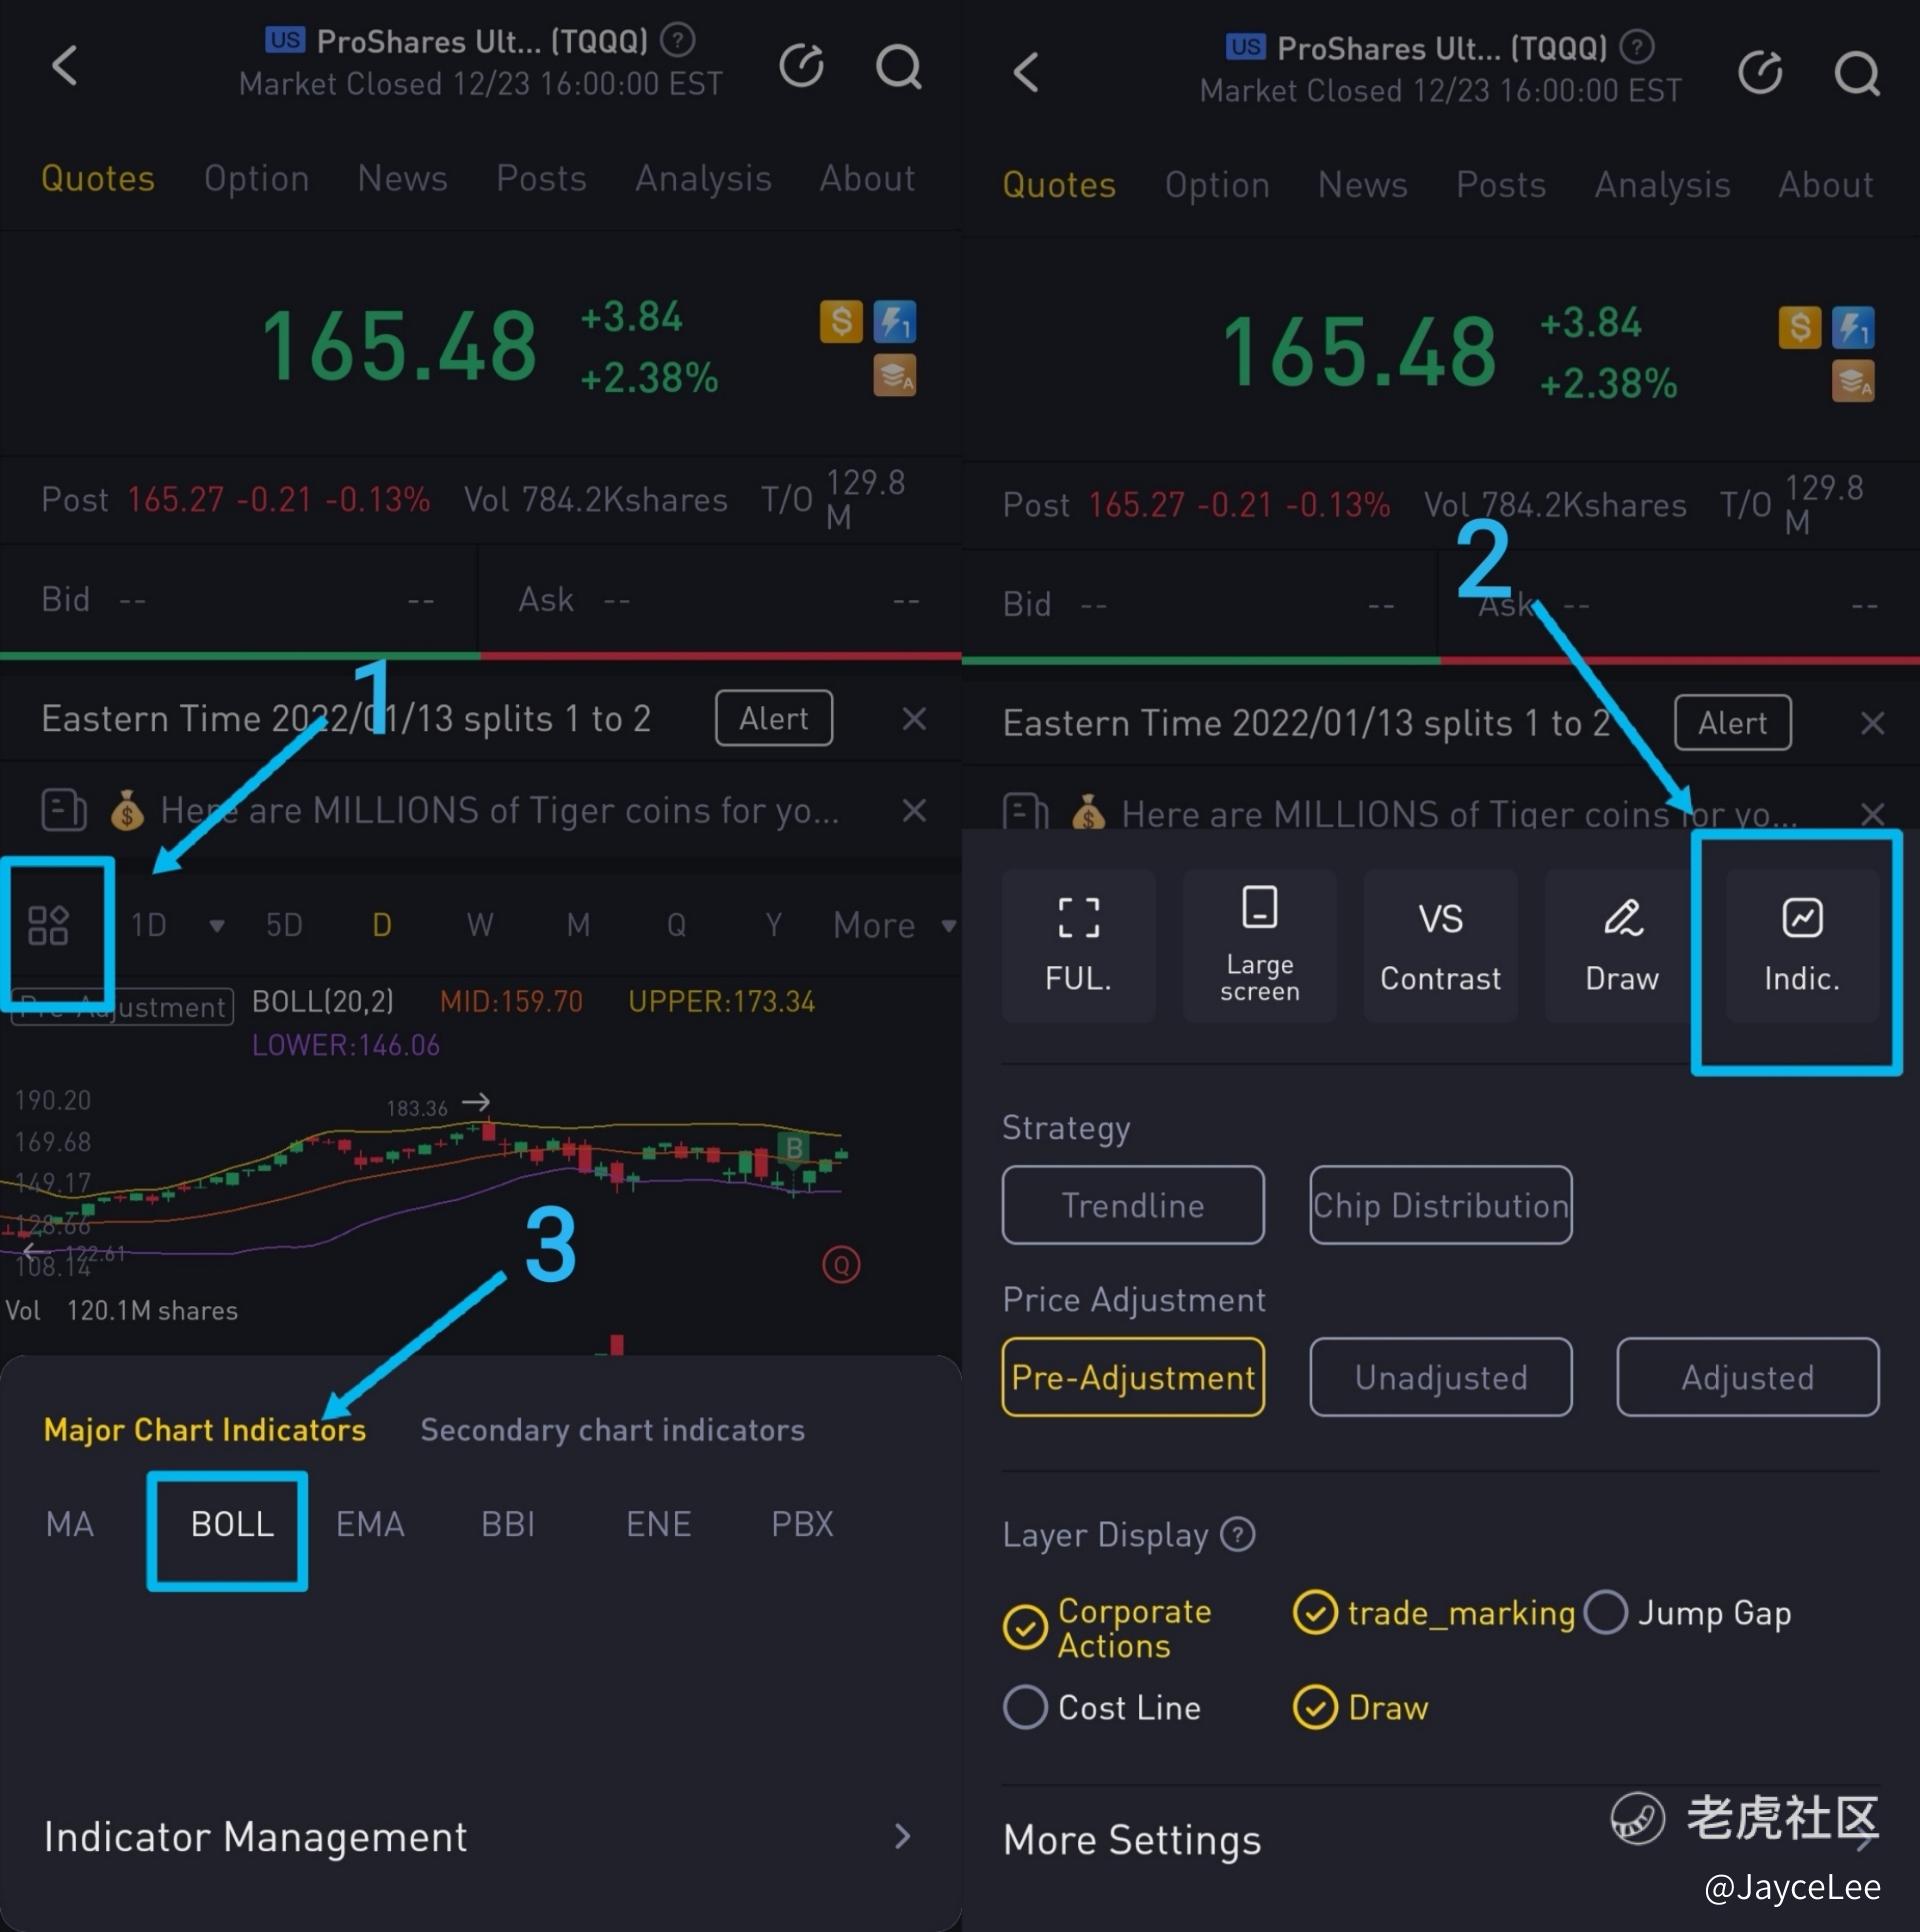
Next, we have to be patient and wait. There are many different indicators available and used by different people. The indicator I use to determine the low is called the Bollinger Bands. To put it simply, when the underlying price exceeds the upper limit, it is overbought, and when the underlying price exceeds the lower limit, it is oversold. You might have guessed it, we should wait for the price to be below the lower limit to average in.
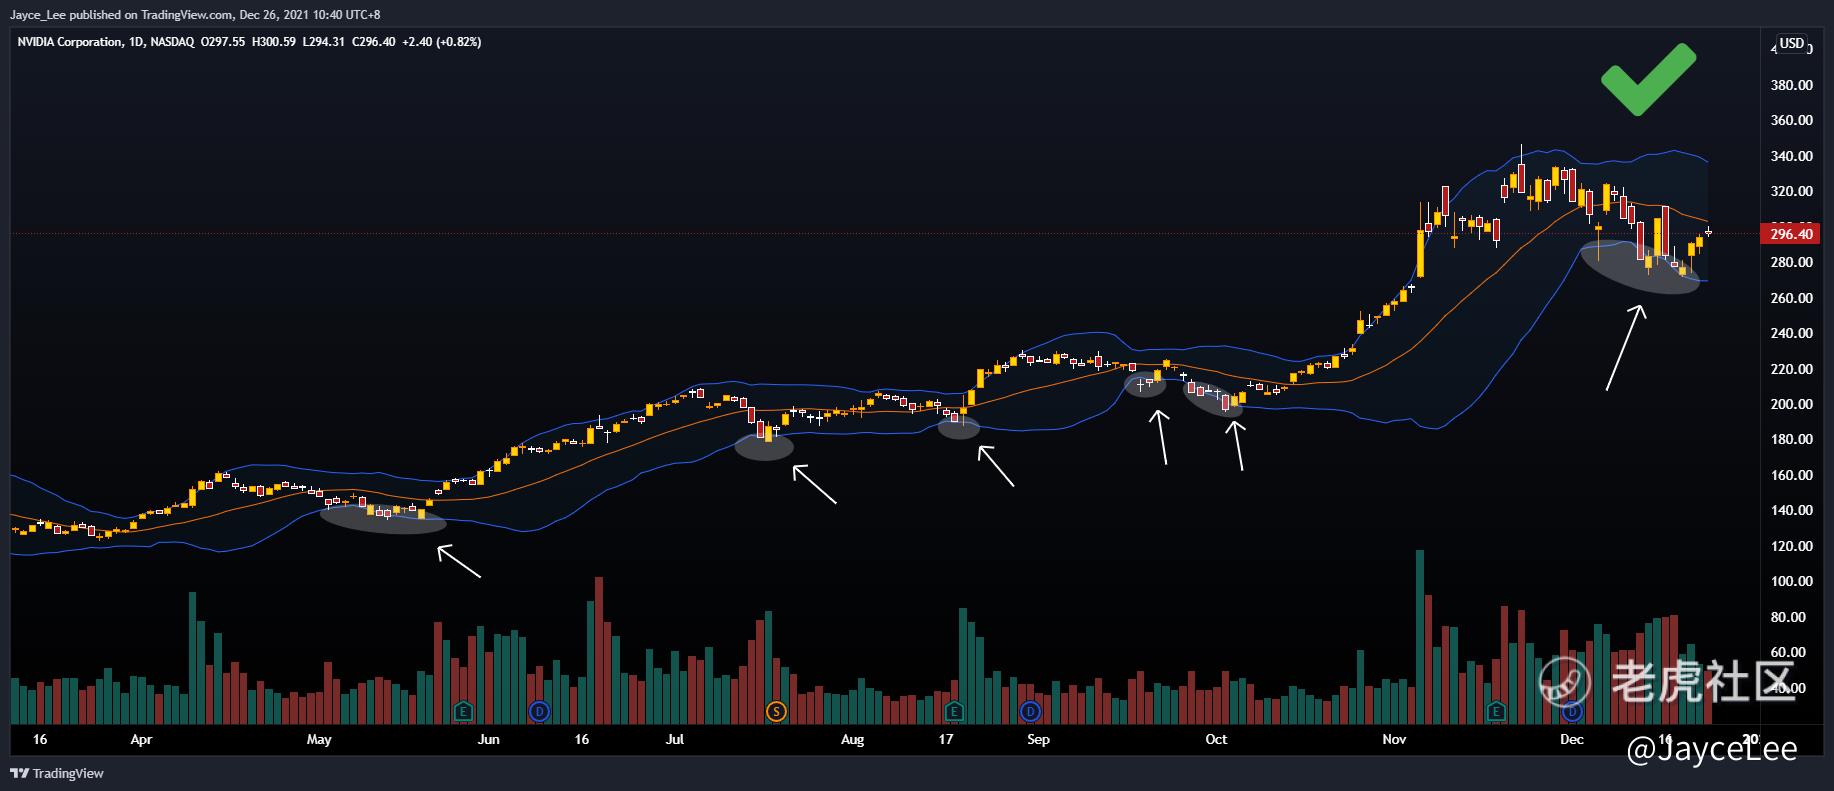
We do not need to add in every time, but when we do plan to average in we can always wait for the price to come down to the lower limit.[正经] (Ref: $纳指三倍做多ETF(TQQQ)$)
Note that this does not guarantee to buy at the low every single time. However, by DCA, we can achieve a decent low cost price for a long-term stock we believe in fundamentally.[哇塞]
Market Psychology behind Price Movement
Indicators can be awesome for buy/sell signals. Nevertheless, we should try to understand the rationale behind the move. I will use $纳指ETF(QQQ)$ as an example for this explanation.[可爱]
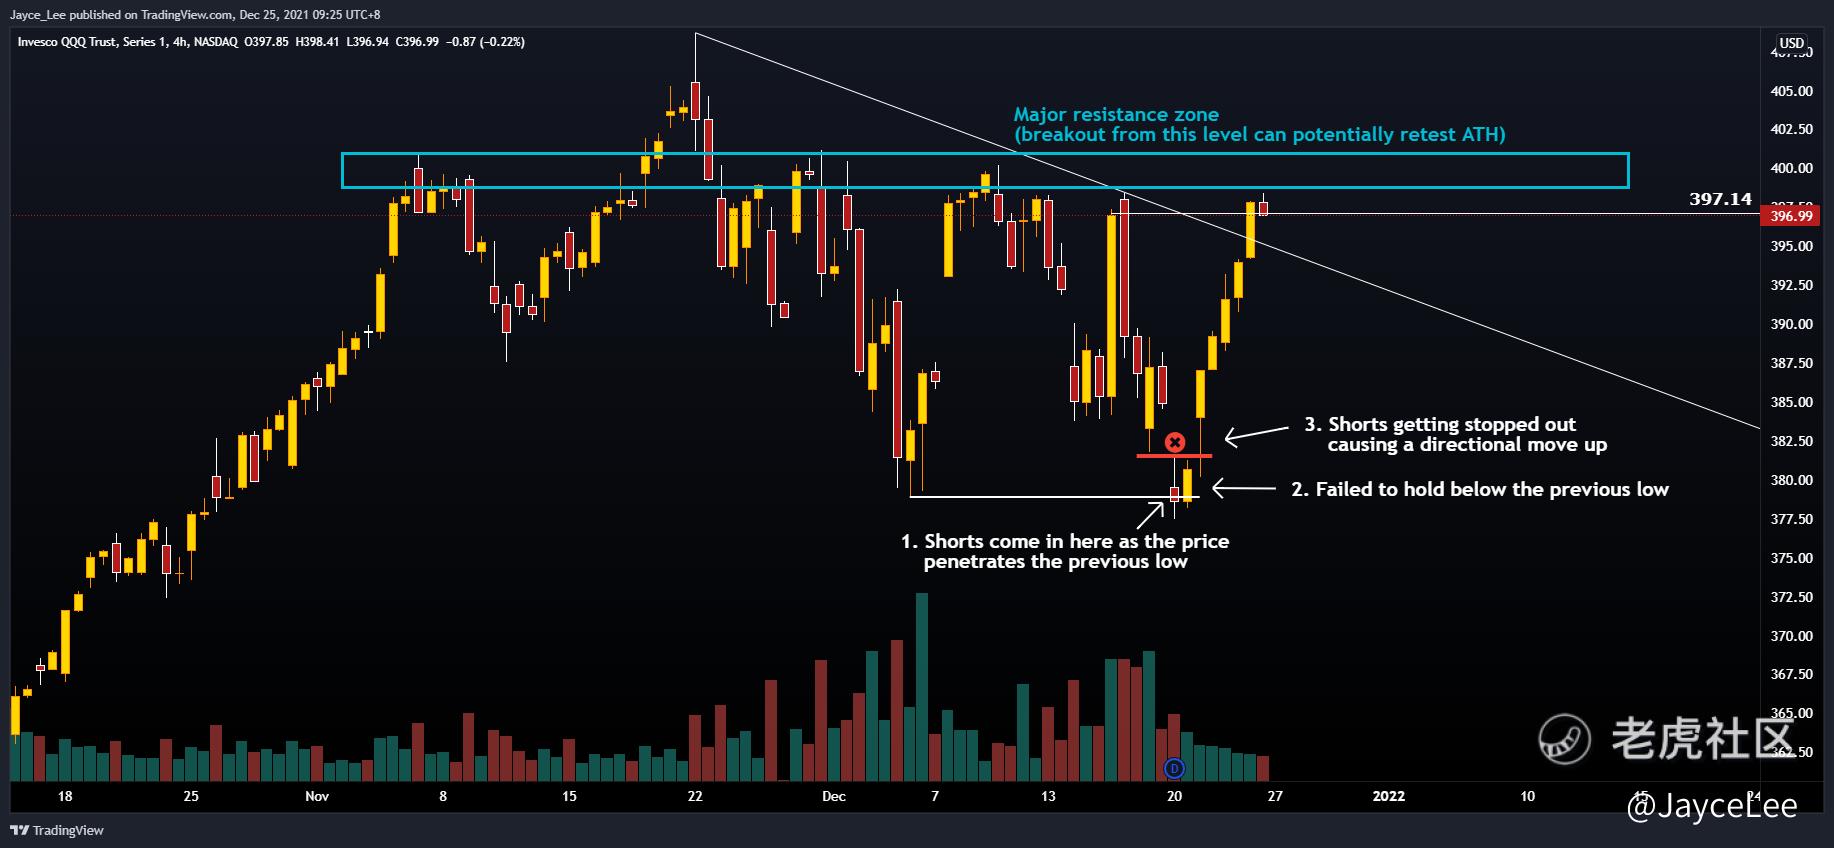
In general, when the price breaks a recent low, it is a bearish sign and there will be shorts entering in hope for another leg downwards. When the penetration of the previous low failed to hold, the shorts who entered will look to get out of the trade.[惊吓] This causes a reversal and a directional move up. We can see a beautiful reversal from the low and now near previous resistance. If it breaks over this resistance, we can potentially see a retest of ATH. A rejection might cause the price to come back down or move sideways.
Conclusion
A fundamentally good stock can be on an uptrend in the long term and trading sideways or on a downtrend in the short term. We can use Bollinger Bands to help us DCA into the stock. Of course, this is just one of the many methods out there, but I hope this will help you in your investment journey.[保佑] Merry Christmas and wish you success![胜利]

Disclaimer: The method mentioned is my own opinion and not investment advice. If you choose to follow the method, do note that you are responsible for your own money. Prioritise your own risk management, expel emotions & focus on your investment plan.[暗中观察] @TigerStars
精彩评论