Market Crash incoming...?[OMG]
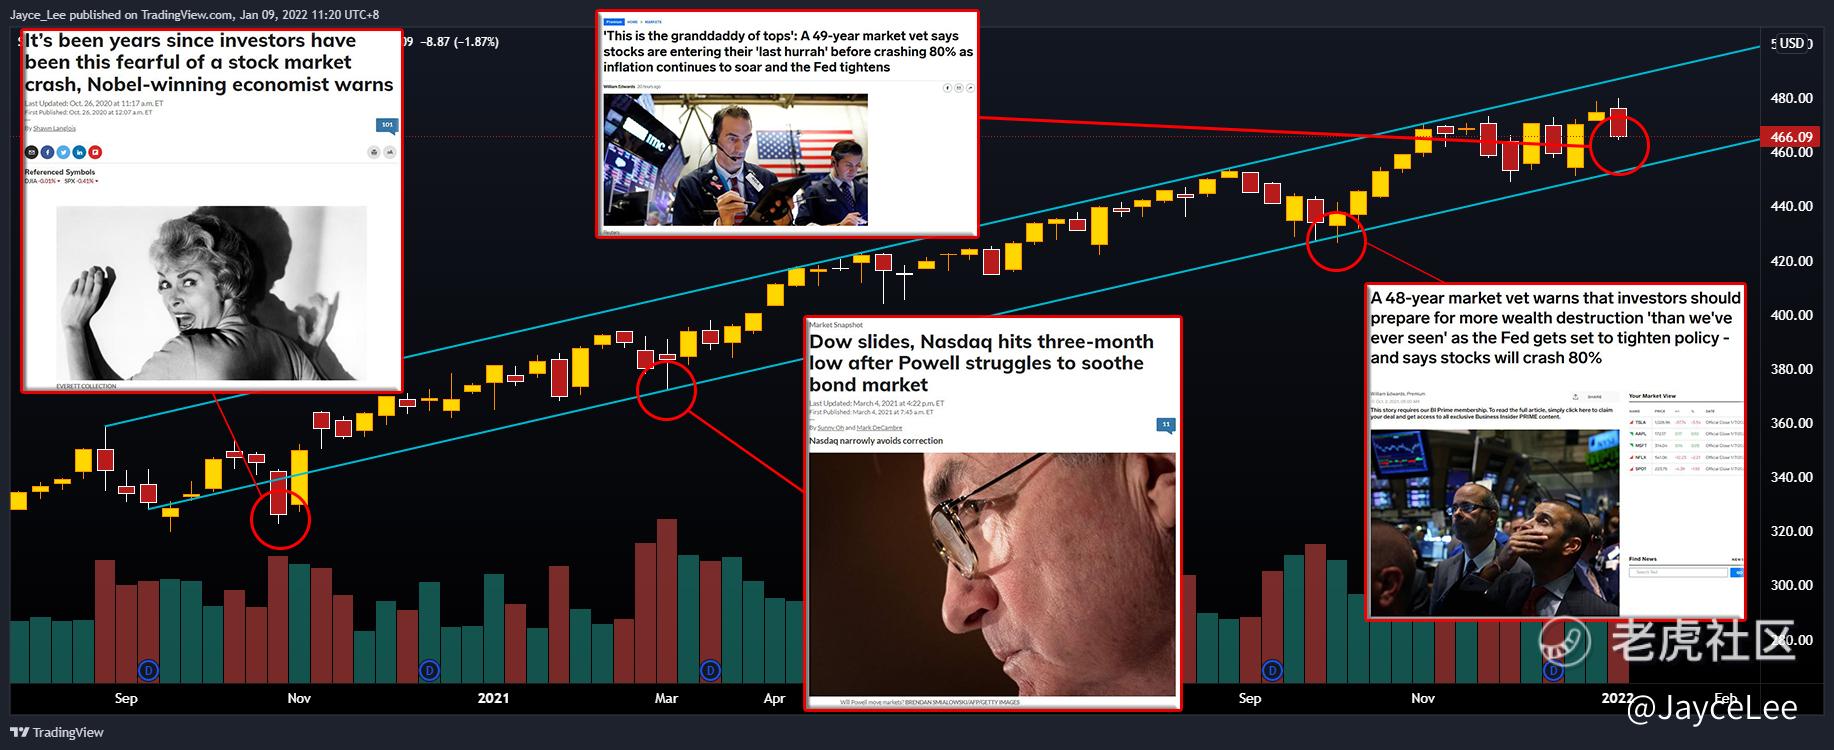
Time and time again there will be articles calling the top and expecting a massive market crash in hopes to be right one time. These articles usually come with pictures of someone sad or shocked.[Duh]
Let's take a look at the previous times these articles appear.[Serious]
"A broken clock is right twice every 24 hours."
Instead of predicting the top, they have been accurately calling the bottom of corrections/retracements more often than not.[Helpless]
Technical Analysis
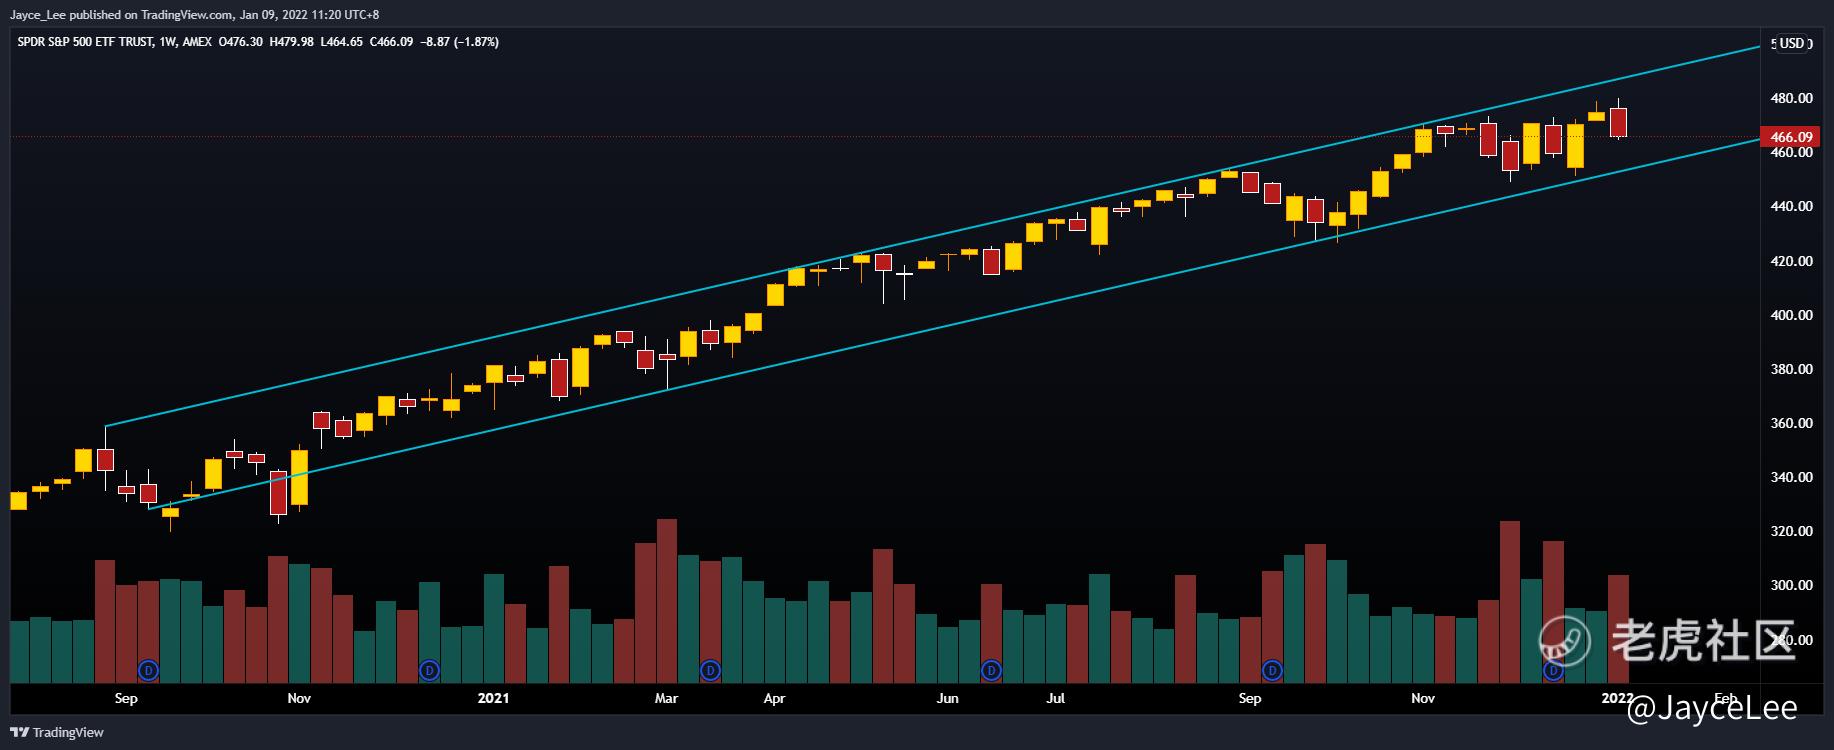
- $S&P500 ETF(SPY)$ Weekly Chart
As we can see, $S&P500 ETF(SPY)$ is still in an uptrend and progressing well in the rising channel. While a small correction is plausible, a market crash is unlikely.[Happy]
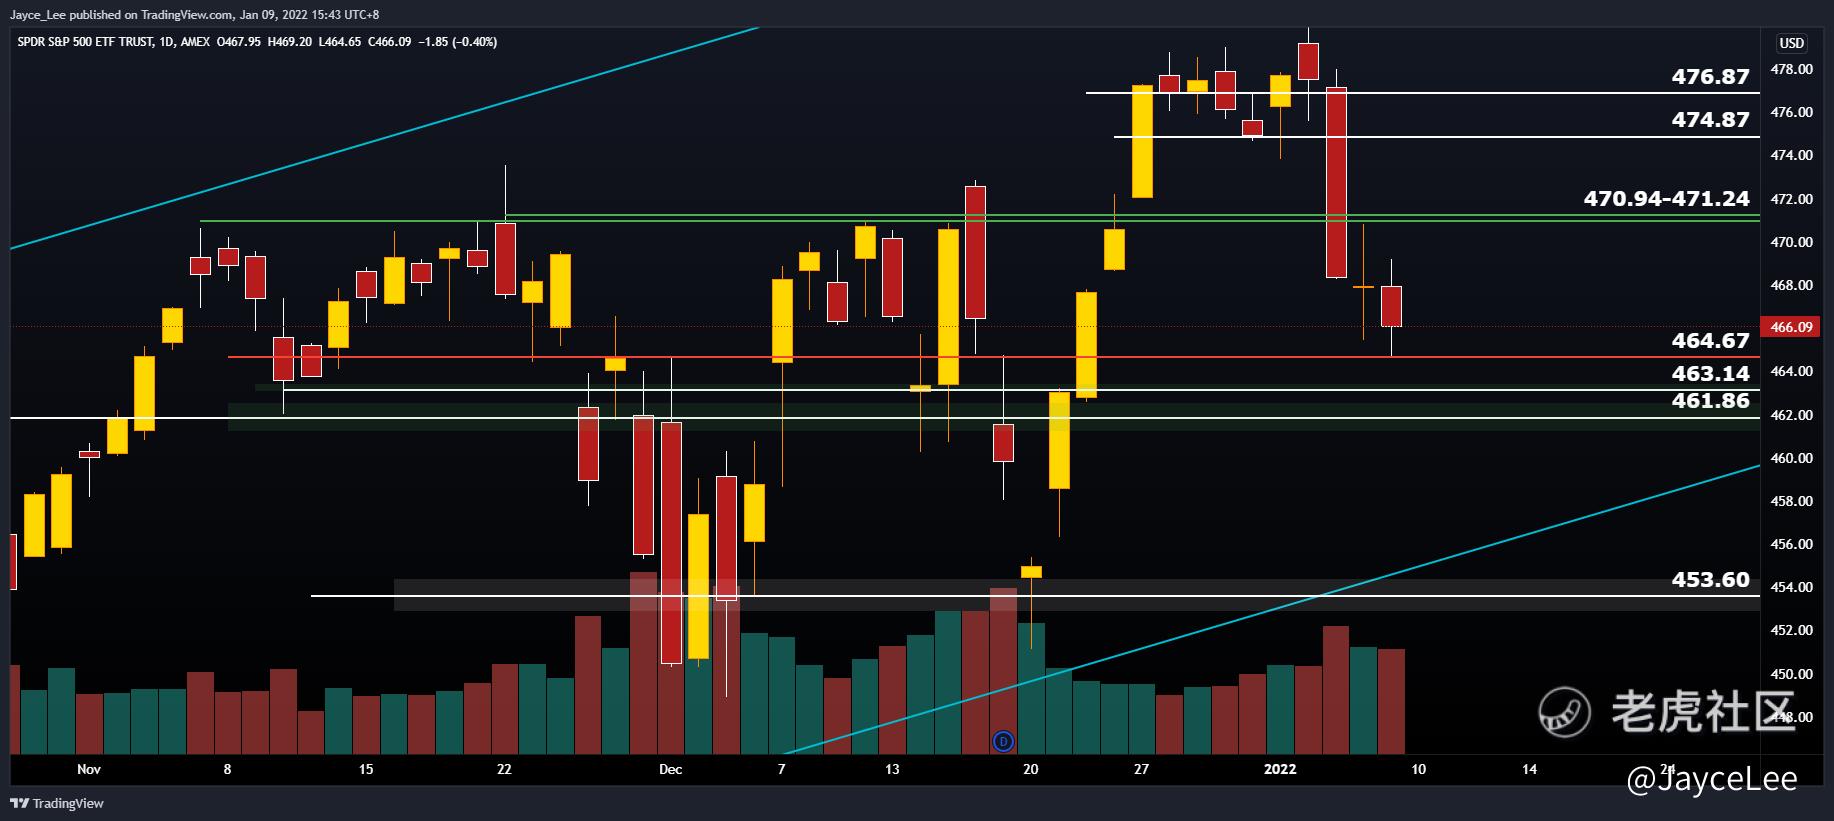
- $S&P500 ETF(SPY)$ Daily Chart
Zooming into the daily chart, a breakthrough and hold above 470.94-471.24 is a bullish sign with targets at 474.87 and 476.87. A breakdown and hold below 464.67 is bearish and my targets will be 463.14 and 461.86. If it breakdowns and fail to hold above 461.86, we can potentially test 453.60.[Blush]
What to do now?
For short-term traders, we can use the levels as guidelines to enter or exit our trades.[Miser]
For long-term investors, we can slowly accumulate more shares of companies we believe in at cheaper prices while the market dips.[Eye]
Disclaimer: The levels given are my own opinions and not investment advice. If you choose to follow the trade, do note that you are responsible for your own money. Prioritise your own risk management, expel emotions & focus on your trading plan.
Intraday trade strategy/guide:
Long-Term investing strategy/guide:
@TigerStars Have an idea to share? Feel free to comment below.[Smart]


精彩评论