
这是我们2023年8月21日发表的《洪灏 | 中日历史的较量》的英文原版报告Hao Hong | Lessons from Japan
SOE developers’ sales still rising strongly, and their stock prices are diverging from those of POEs. Thus, housing demand is probably delayed, not disappearing.
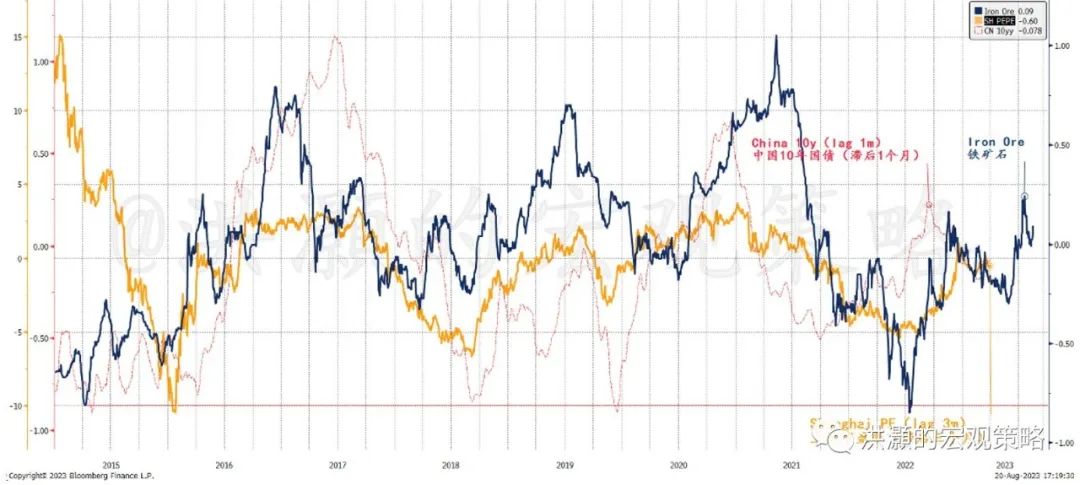
The momentum in iron ore price is rising, and tends to lead long bond yield and market recovery by one and three months, respectively.
So far, the market recovery is driven more by valuation than by fundamentals. Policies must deliver. And China’s private sector leverage is similar to that of Japan in 1993. It is a significant turning point that warrants all attentions and resources.
Some leading indicators not “lying flat”
In July, property sales, prices, investments are taking another turn down, on an already-low base for comparison. At this juncture, it is easier to be a pessimist than an optimist. Thus, being pessimistic is not adding value anymore, except probably for the eyeballs. After examining recent property data, we would like to raise a few curiosities. Note that we are neither pessimistic as the prevalent consensus, nor optimistic like pollyannas. We are simply being realistic.
1) SOE developers are doing well and are indeed registering strong y/y sales growth in July, amid general sector weakness. Yuexiu, for instance, is experiencing 68% y/y sales growth in the first seven months of the year. And for Poly, it is 109%. If the demand for property has evaporated, as some pundits are alleging, then why people are still buying from SOEs? Is the fulfillment of property demand subject to the ownership of the developers? Obviously, the concerns for “unfinished buildings” (烂尾楼) still overwhelm.
Figure 1: Iron ore has made a significant low in 2H22, and its momentum is picking up.
Of course, these significant SOE developers we track consist only 18% of national area sales and 28% of national yuan sales, but their strong sales hint at continuing housing demand that is not affected by the general market conditions and prevalent pessimism. And these developers make up ~50% national area sales and over 60% of national yuan sales of the nationally-significant SOE and POE developers that we track.
2) Second-hand property market appears ailing, as shown in declining listing prices, larger seller concessions and more listing amid falling prices. But rent is rising, suggesting that people are delaying buying decision and renting instead. If so, the housing demand probably is delayed, not disappearing.
Obviously, some may question why people are not simply buying second-hand property, if they are so concerned about “unfinished buildings”? The answer may stem from Chinese culture of the preference to buy new instead of second hand, as well as the age of Chinese housing stock -- more than 85% of China’s housing stock is more than 5 y.o., and about two thirds is more than 10 y.o. And Chinese properties depreciate really fast for lack of proper maintenance.
3) SOE developers’ stock prices remain resilient, and some even rise amid such gloom. But POE developers’ stock prices are indeed plunging. What could explain such disparity of fortune between the two groups of developers with different ownership structure, if the sector is in complete despair?
And how do the cross-asset prices reflect these curious nuances within the property sector?
In Figure 1, we show that the price of iron ore, an important leading indicator for the Chinese economy, is picking up momentum. It is evident that iron ore has made a significant bottom in 2H22, and has been recovering ever since. In general, it leads the P/E of the Shanghai Composite by about three months, and China’s 10-year treasury yield by about one month.
If iron ore continues its recovery to signal improving underlying demand in the Chinese economy on the margin, then the Shanghai Composite should continue its valuation recovery, despite near-term volatility.
The down trend in China’s long treasury yield should also revert, after making its low in the coming weeks. This projection appears to be consistent with the inflation outlook in the second half, when deflationary pressure in the upstream will likely ease due to higher commodity prices and pork price will likely stop dragging on CPI.
… But longer-term outlook murky
While we have raised some interesting questions above, we note that the property sector is confronted with significant challenges. In Figure 2, we can see that while the property sector valuation has recovered somewhat, the relative performance of high-yield property USD bonds versus investment-grade bonds is heading for a second low, in tandem with Chinese consumer confidence and the property sector index.
Figure 2: The market recovery is mostly driven by valuation, but reality has failed to deliver.
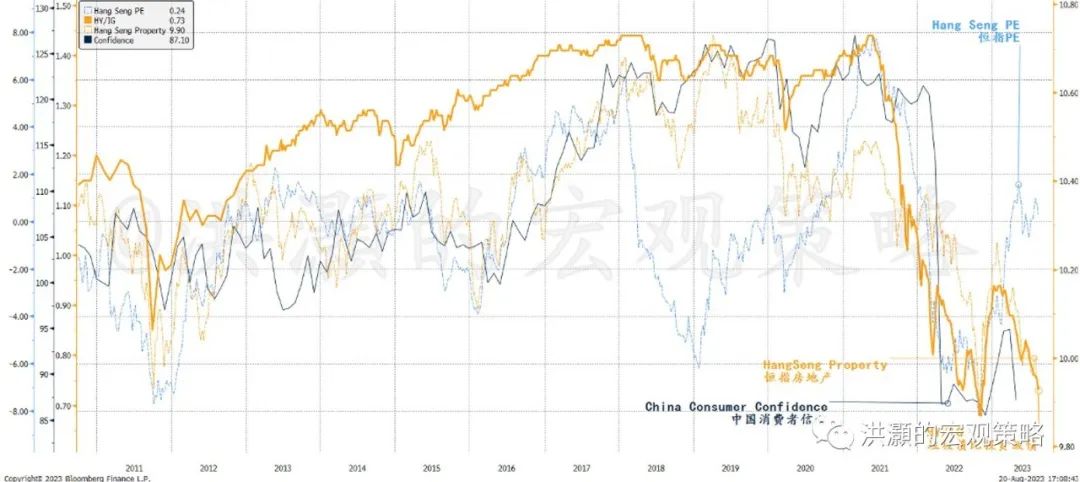
As valuation recovery diverges from confidence and relatively high-yield performance, the recovery so far has been driven more by hopes than by reality. But hopes and dreams can only get us this far, if economic fundamentals fail to deliver. That said, we don’t believe that 2023 should be even worse than 2022, when our future was shrouded by the ravage of COVID. As such, the market low in late October 2022 should hold.
But longer-term outlook appears murky. Recently, there has been heated debates among economists, drawing parallels between China and Japan. After all, Japan’s “lost decades” have resonated loudly in today’s China. But we fail to see concrete comparison based on data, except for some anecdotal evidence and eloquent babbles that reciting clichés that fail to add anything to the debate. But people carry on debating each other regardless.
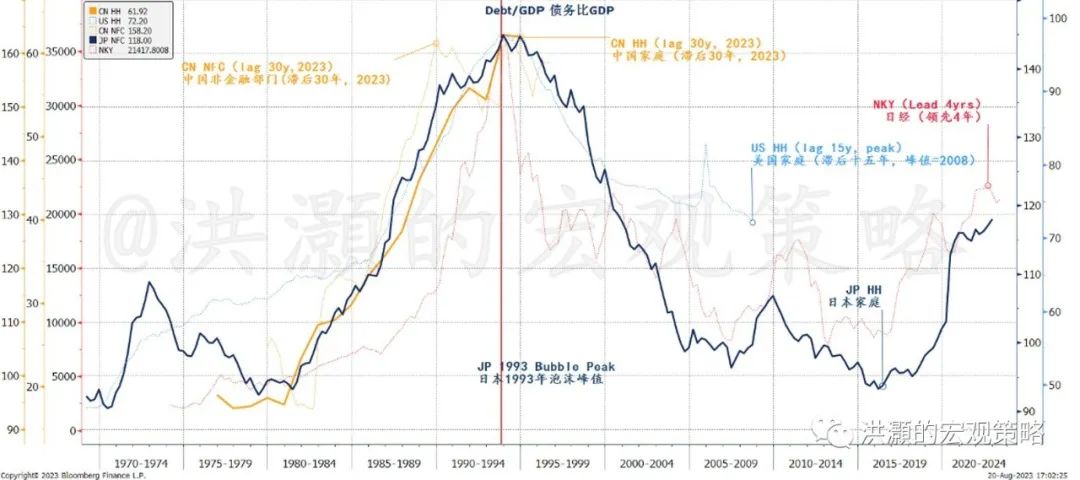
Here, we compare the household/private-debt-to-GDP ratios between Japan at the peak of its property bubble in 1993 and China now in 2023 (Figure 3). We can show that China’s ratio is now ~150% GDP, similar to that of Japan in 1993. Further, the pace at which China’s private sector is adding on leverage also bears uncanny resemblance.
This is a critical chart that goes without saying. Its significance is beyond the scope of this short note. We will return to it at a later date with more.
Figure 3: China’s private debt/GDP vs that of Japan, US at the peak of their property bubble, respectively.
Conclusion
The Chinese property market is beset by pessimism. Yet people are still buying from SOE developers, and the rising rent suggests that housing demand is delayed rather than disappearing. As such, the SOE developers’ stock prices have diverged from those of POEs.
Iron ore price is picking up some momentum, and suggest that the valuation recovery in the Shanghai Composite should resume after recent turmoil, and the Chinese 10-year should soon find some support around its recent lows, if history is a guide. If we agree that 2023 is already much better than 2022, then the low in late October 2022 should hold.
Longer term, however, the picture is murkier. China’s private sector leverage has reached a plateau similar to that of Japan at the peak of its bubble in 1993. It is a significant turning point that warrants all attentions and resources.
Hao Hong,CFA
TWT:@HAOHONG_CFA
精彩评论