The moving average (MA) is a simple technical analysis tool that smooths out price data by creating a constantly updated average price. The average is taken over a specific period of time, like 10 days, 20 minutes, 30 weeks or any time period the trader chooses. There are advantages to using a moving average in your trading, as well as options on what type of moving average to use. Moving average strategies are also popular and can be tailored to any time frame, suiting both long-term investors and short-term traders.
Key Takeaways
1. A moving average (MA) is a widely used technical indicator that smooths out price trends by filtering out the "noise" from random short-term price fluctuations.
2. Moving averages can be constructed in several different ways, and employ different numbers of days for the averaging interval.
3. The most common applications of moving averages are to identify trend direction and to determine support and resistance levels.
4. When asset prices cross over their moving averages, it may generate a trading signal for technical traders.
5. While moving averages are useful enough on their own, they also form the basis for other technical indicators such as the moving average convergence divergence (MACD).
Why Use a Moving Average
A moving average helps cut down the amount of "noise" on a price chart. Look at the direction of the moving average to get a basic idea of which way the price is moving. If it is angled up, the price is moving up (or was recently) overall; angled down, and the price is moving down overall; moving sideways, and the price is likely in a range.
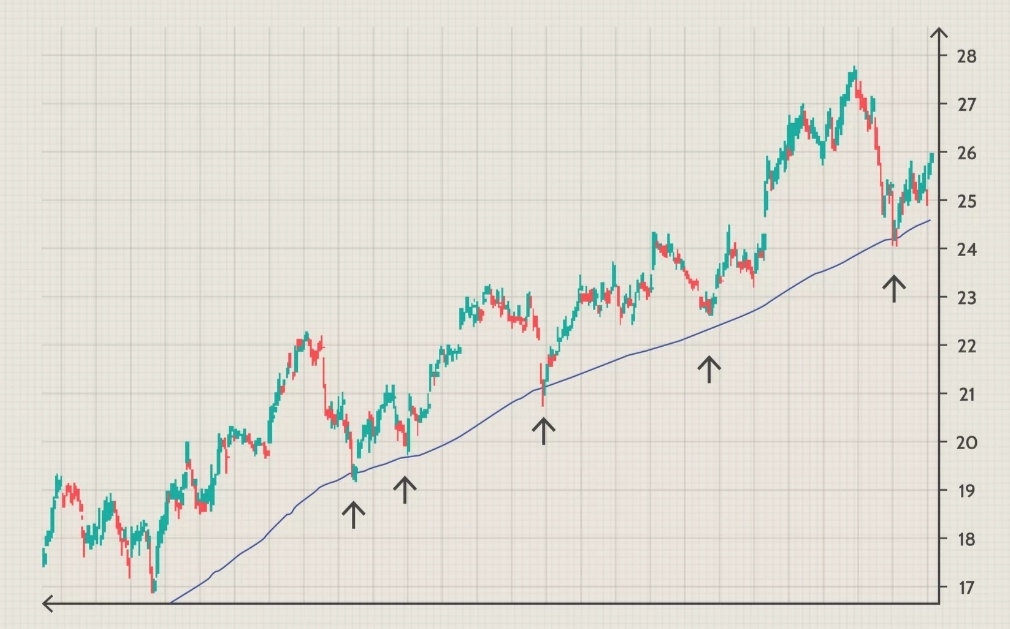
A moving average can also act as support or resistance. In an uptrend, a 50-day, 100-day or 200-day moving average may act as a support level, as shown in the figure below. This is because the average acts like a floor (support), so the price bounces up off of it. In a downtrend, a moving average may act as resistance; like a ceiling, the price hits the level and then starts to drop again.
The price won't always "respect" the moving average in this way. The price may run through it slightly or stop and reverse prior to reaching it.
As a general guideline, if the price is above a moving average, the trend is up. If the price is below a moving average, the trend is down. However, moving averages can have different lengths (discussed shortly), so one MA may indicate an uptrend while another MA indicates a downtrend.

精彩评论