
Welles Wilder's Parabolic Stop and Reverse (SAR) is a trailing stop-based trading system; it is often used as an indicator as well. The SAR uses a trailing stop level that follows prices as they move up or down. The stop level increases speed based on an "Acceleration Factor." When plotted on the chart, this stop level resembles a parabolic curve, thus the indicator's name. The parabolic function accepts three parameters. The first two control the acceleration during up and down moves, respectively. The last parameter determines the maximum acceleration.
The Parabolic SAR assumes that you are trading a trend and, therefore, expects price to change over time. If you are long, the Parabolic SAR will move the stop upward every period, regardless of whether the price has moved. Parabolic SAR moves downward if you are short.
How this indicator works
1. The Parabolic SAR trading system uses the parabolic level as a "stop and reverse" point, calculating the stop for each upcoming period. When the stop is hit you close the current trade and initiate a new trade in the opposite direction. This system keeps you invested in the market at all times.
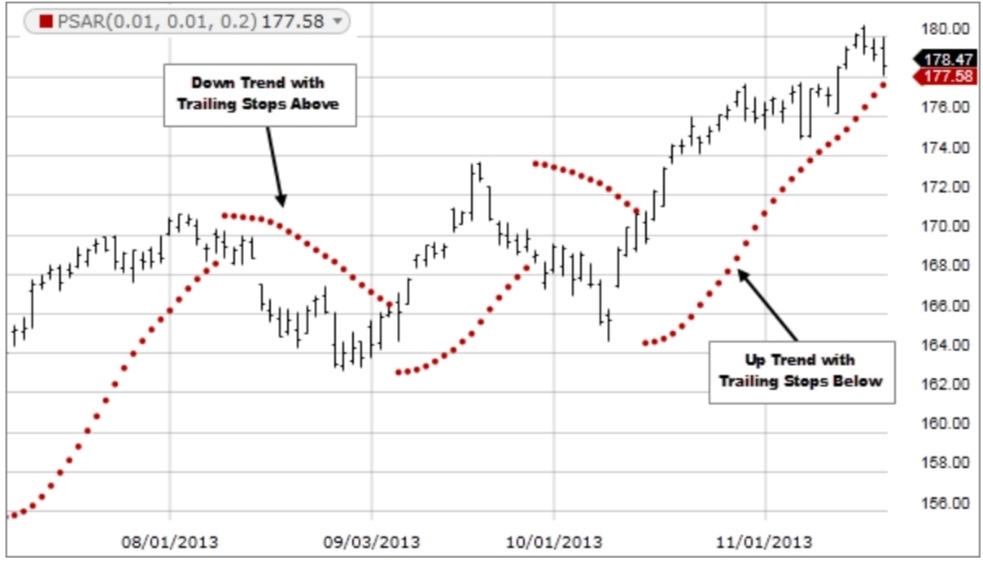
2. The indicator is usually shown as a series of dots above or below the price bars. The dots are the stop levels. You should be short when the stops are above the bars; you should be long when the stops are below the bars.
3. The Parabolic SAR may cause whipsaws during sideways or trendless markets.
4. The Parabolic SAR excels in fast-moving trends that accelerate as they progress. The stops are also calculated to accelerate; hence you need to have the correct "Acceleration Factor" to match the market you are trading. Up and down acceleration parameters may be different.
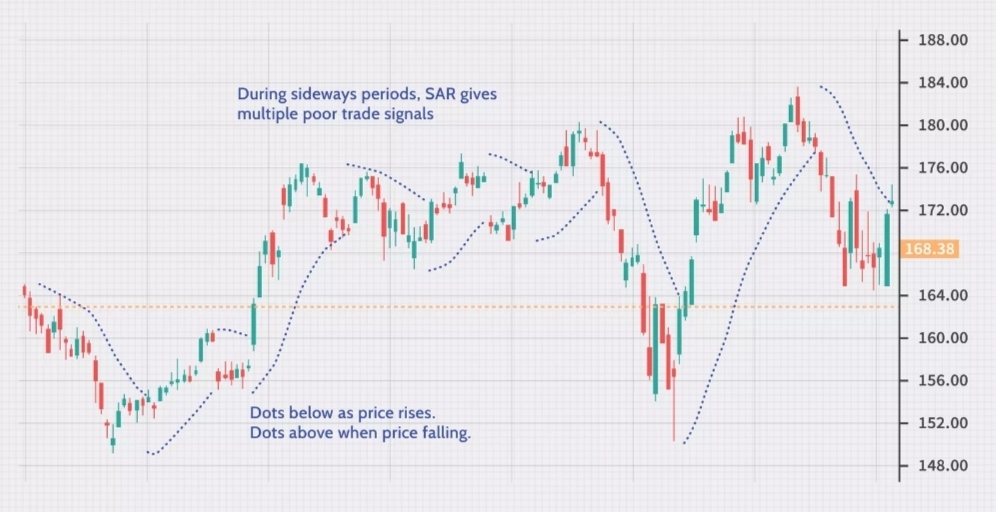
The chart above shows that the indicator works well for capturing profits during a trend, but it can lead to many false signals when the price moves sideways or is trading in a choppy market. The indicator would have kept the trader in the trade while the price rose. When the price is moving sideways, the trader should expect more losses and/or small profits.
The following chart shows a downtrend, and the indicator would have kept the trader in a short trade (or out of longs) until the pullbacks to the upside began. When the downtrend resumed, the indicator got the trader back in.
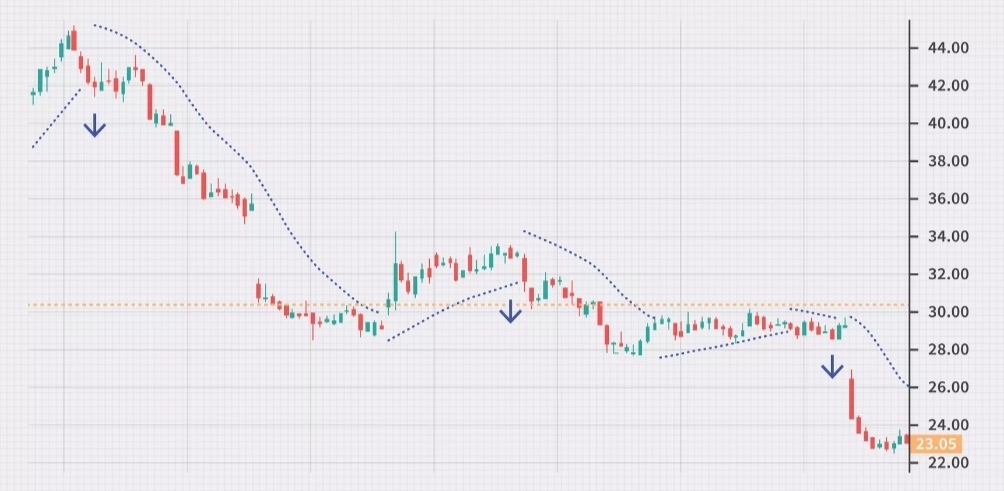
The parabolic SAR is also a method for setting stop-loss orders. When a stock is rising, move the stop-loss to match the parabolic SAR indicator. The same concept applies to a short trade—as the price falls, so will the indicator. Move the stop-loss to match the level of the indicator after every price bar.
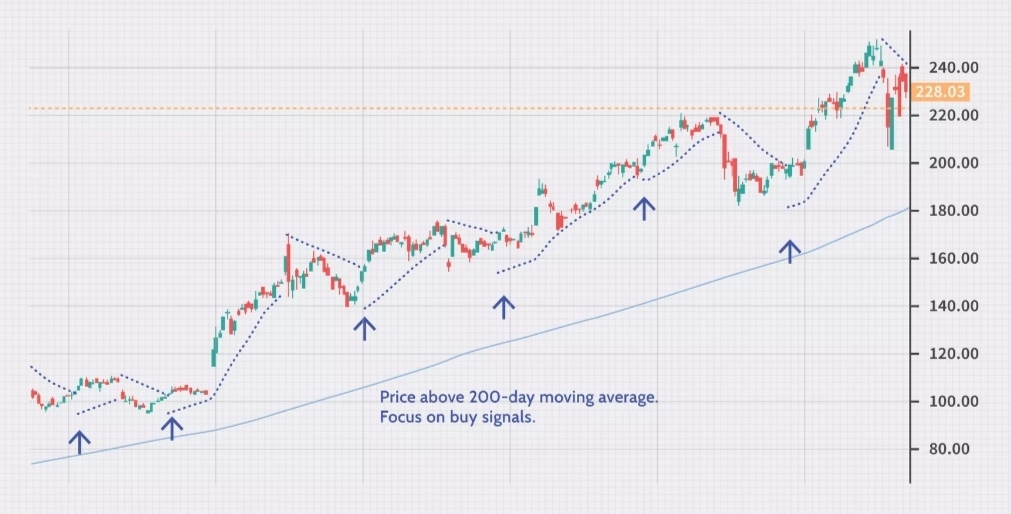
Similarly, if the price is above the moving average, focus on taking the buy signals (dots move from above to below). The SAR indicator can still be used as a stop-loss, but since the longer-term trend is up, it is not wise to take short positions.
The Bottom Line
The parabolic SAR is used to gauge a stock's direction and for placing stop-loss orders. The indicator tends to produce good results in a trending environment, but it produces many false signals and losing trades when the price starts moving sideways. To help filter out some of the poor trade signals, only trade in the direction of the dominant trend. Some other technical tools, such as the moving average, can aid in this regard.
精彩评论