
Bollinger Bands are a type of price envelope developed by John Bollinger (Price envelopes define upper and lower price range levels.) Bollinger Bands are envelopes plotted at a standard deviation level above and below a simple moving average of the price. Because the distance of the bands is based on standard deviation, they adjust to volatility swings in the underlying price.
Bollinger Bands use 2 parameters, Period and Standard Deviations, StdDev. The default values are 20 for period, and 2 for standard deviations, although you may customize the combinations.
Bollinger bands help determine whether prices are high or low on a relative basis. They are used in pairs, both upper and lower bands and in conjunction with a moving average. Further, the pair of bands is not intended to be used on its own. Use the pair to confirm signals given with other indicators.
How this indicator works
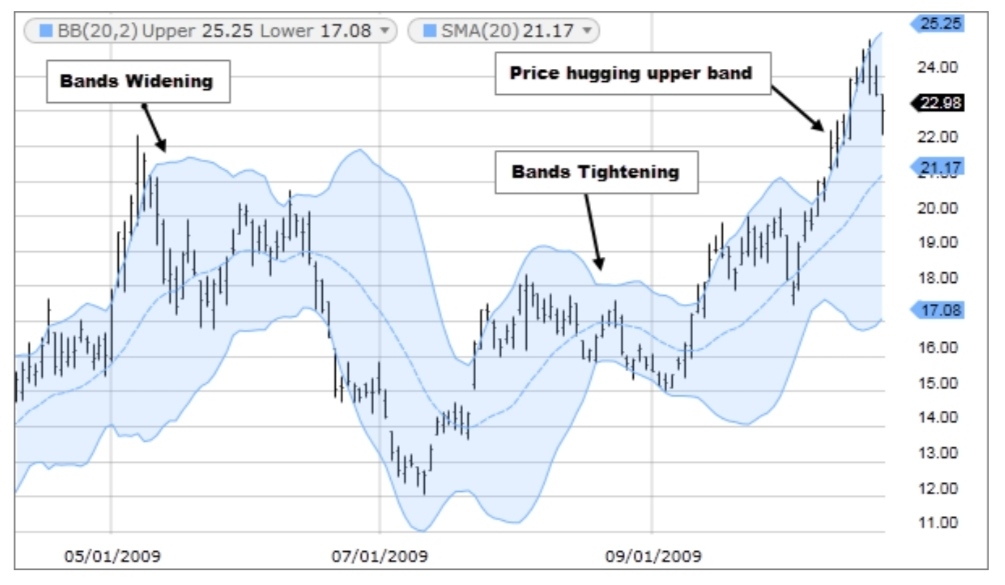
1. When the bands tighten during a period of low volatility, it raises the likelihood of a sharp price move in either direction. This may begin a trending move. Watch out for a false move in opposite direction which reverses before the proper trend begins.
2. When the bands separate by an unusual large amount, volatility increases and any existing trend may be ending.
3. Prices have a tendency to bounce within the bands' envelope, touching one band then moving to the other band. You can use these swings to help identify potential profit targets. For example, if a price bounces off the lower band and then crosses above the moving average, the upper band then becomes the profit target.
4. Price can exceed or hug a band envelope for prolonged periods during strong trends. On divergence with a momentum oscillator, you may want to do additional research to determine if taking additional profits is appropriate for you.
5. A strong trend continuation can be expected when the price moves out of the bands. However, if prices move immediately back inside the band, then the suggested strength is negated.
Key Takeaways
1. Bollinger Bands are a technical analysis tool developed by John Bollinger for generating oversold or overbought signals.
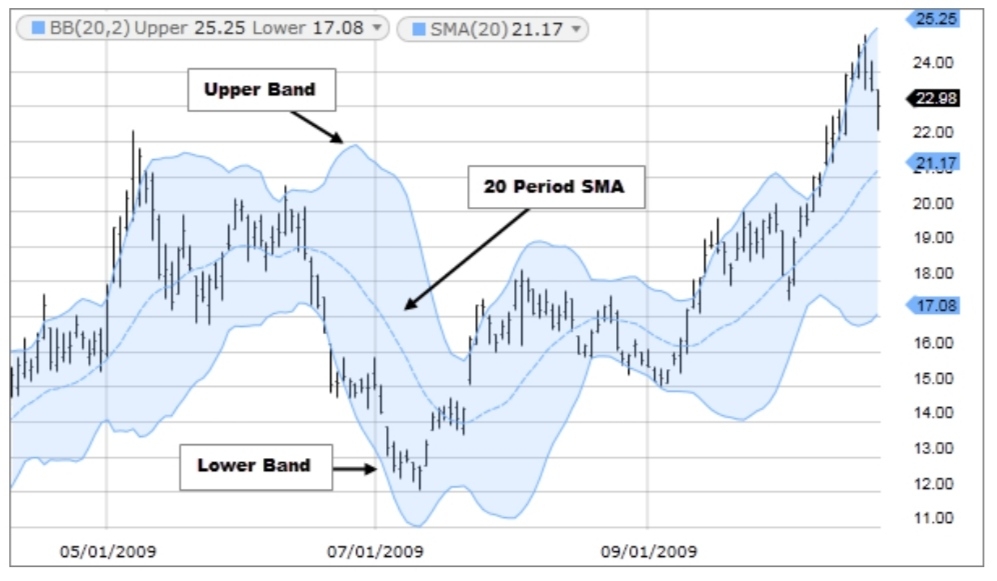
2. There are three lines that compose Bollinger Bands: A simple moving average (middle band) and an upper and lower band.
3. The upper and lower bands are typically 2 standard deviations +/- from a 20-day simple moving average, but can be modified.
Limitations
Bollinger Bands are not a standalone trading system. They are simply one indicator designed to provide traders with information regarding price volatility. John Bollinger suggests using them with two or three other non-correlated indicators that provide more direct market signals. He believes it is crucial to use indicators based on different types of data. Some of his favored technical techniques are moving average divergence/convergence (MACD), on-balance volume and relative strength index (RSI).
Because they are computed from a simple moving average, they weight older price data the same as the most recent, meaning that new information may be diluted by outdated data. Also, the use of 20-day SMA and 2 standard deviations is a bit arbitrary and may not work for everyone in every situation. Traders should adjust their SMA and standard deviation assumptions accordingly and monitor them.
精彩评论