My support & resistance for $Apple(AAPL)$
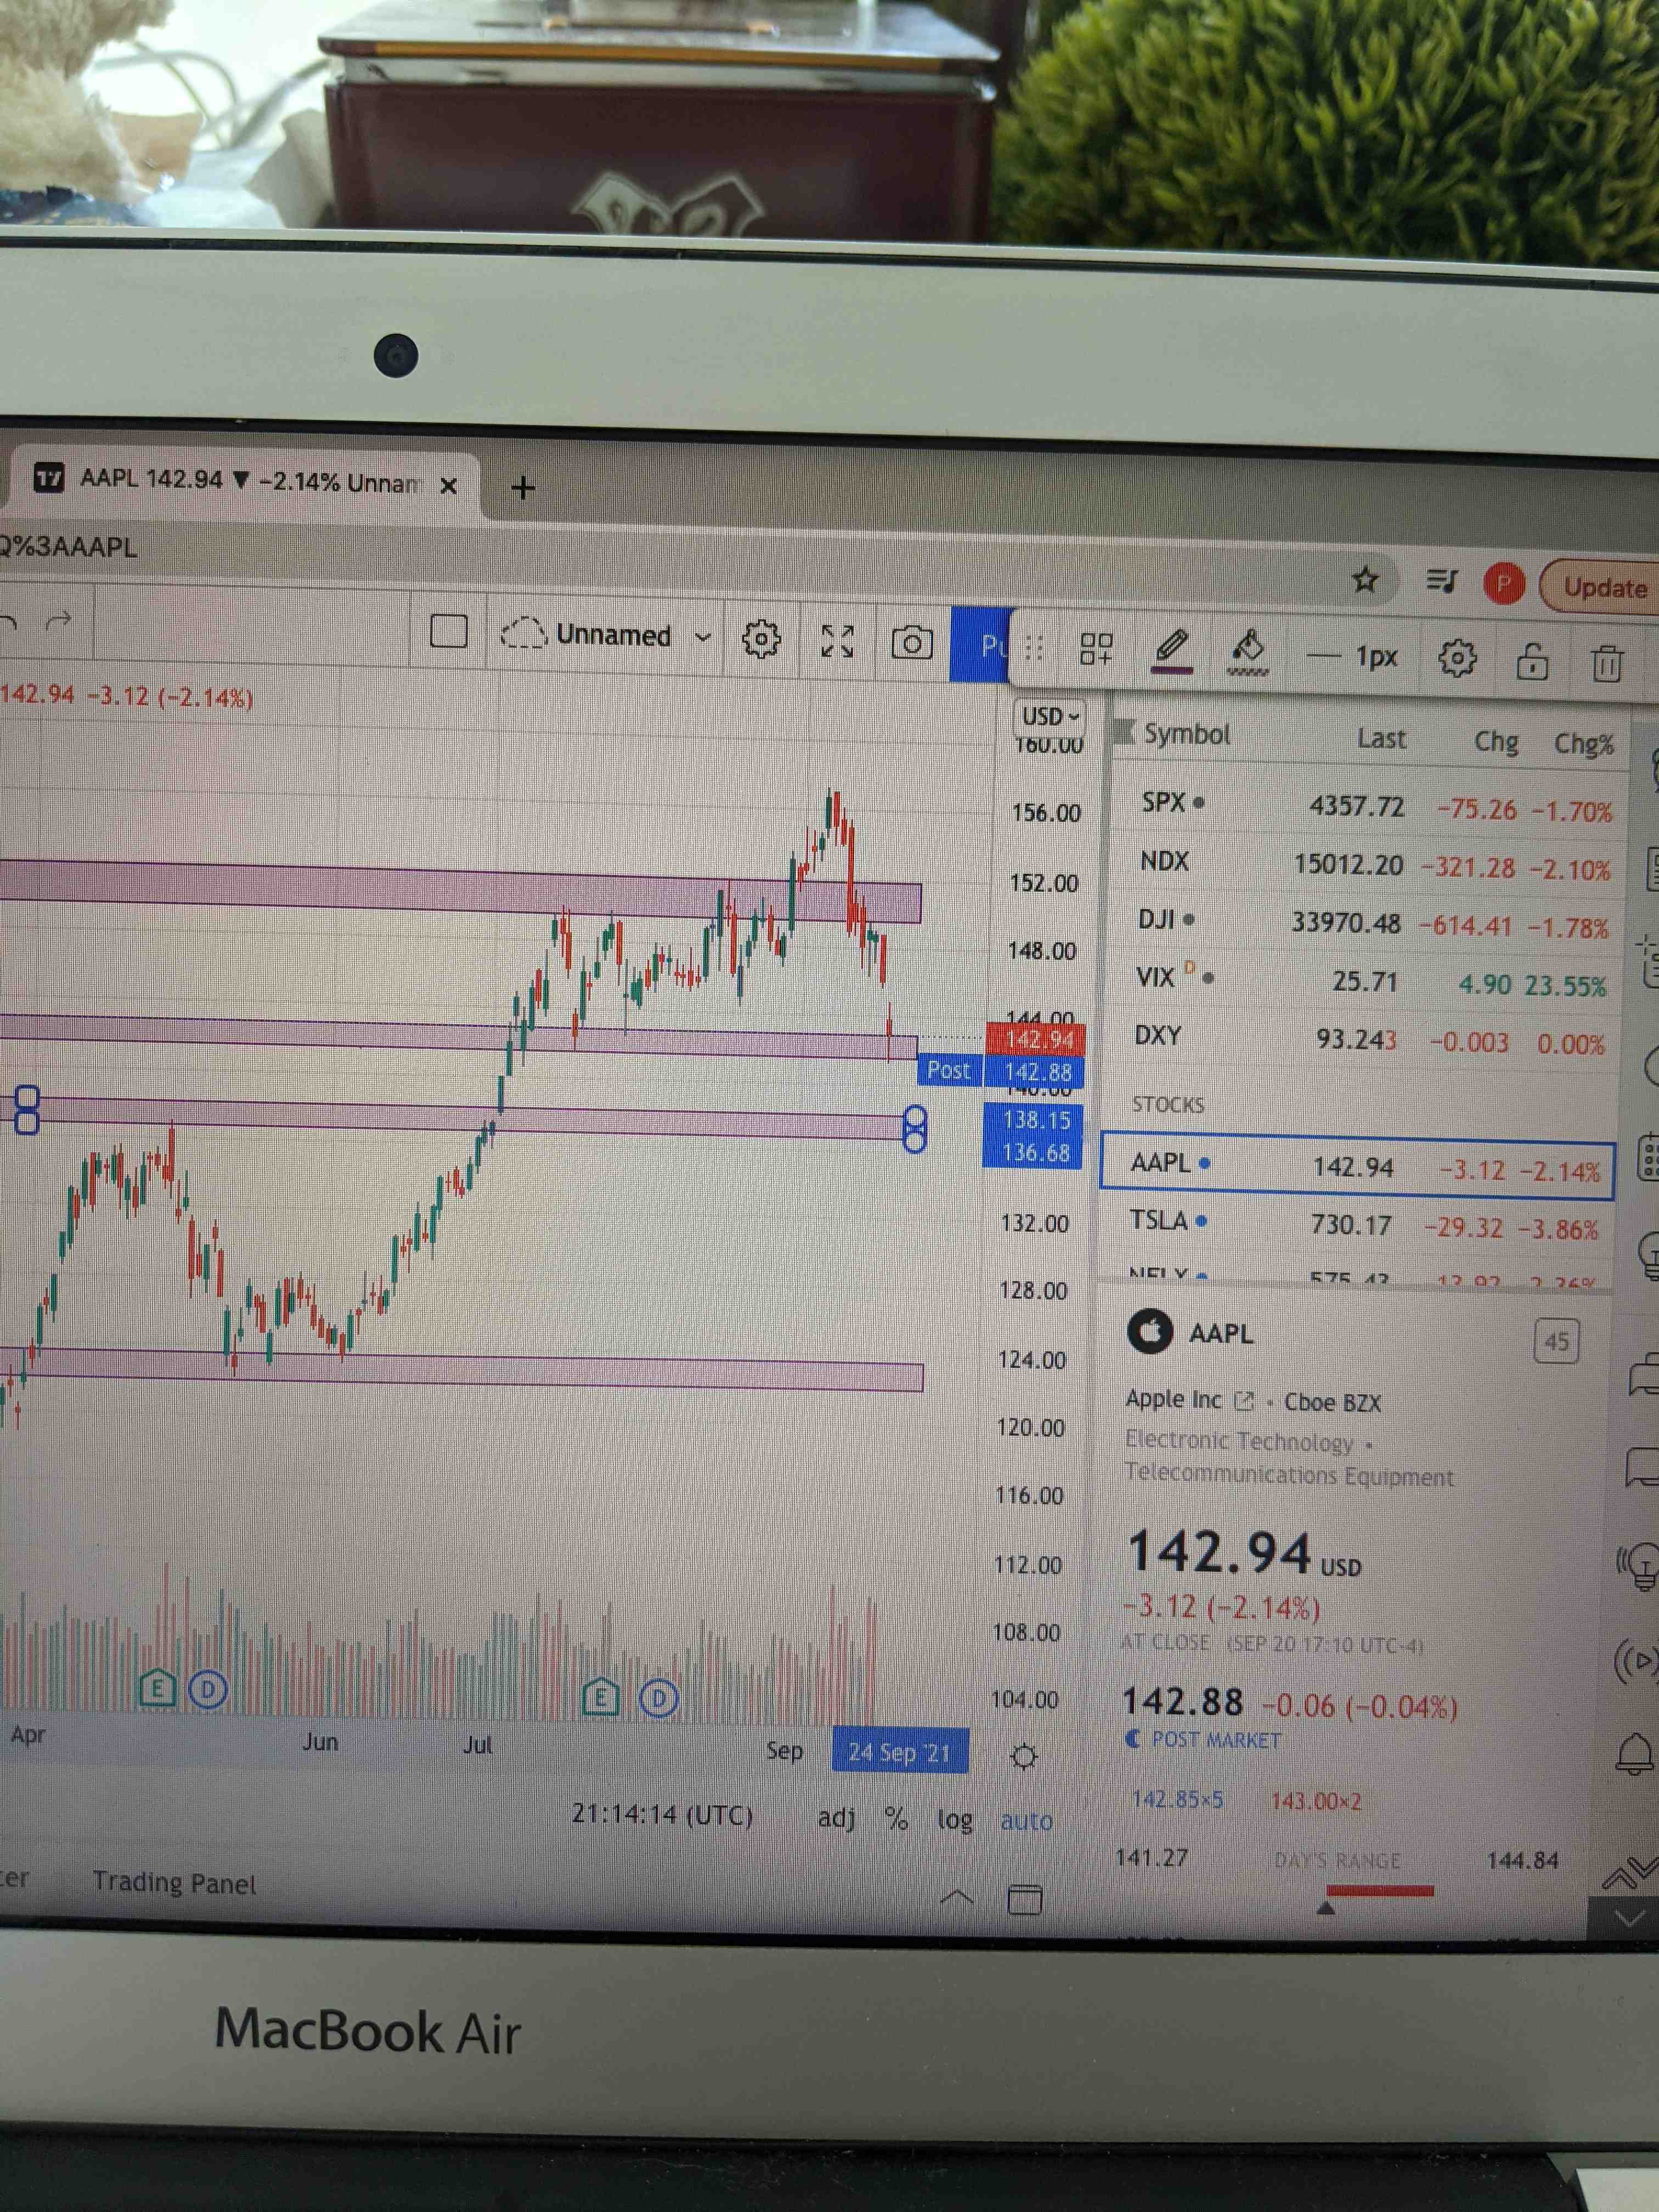
Following my first example of how I drew S&R zone boxes for $Palantir Technologies Inc.(PLTR)$, please refer to the pictures of white chart for what I have drawn for AAPL.
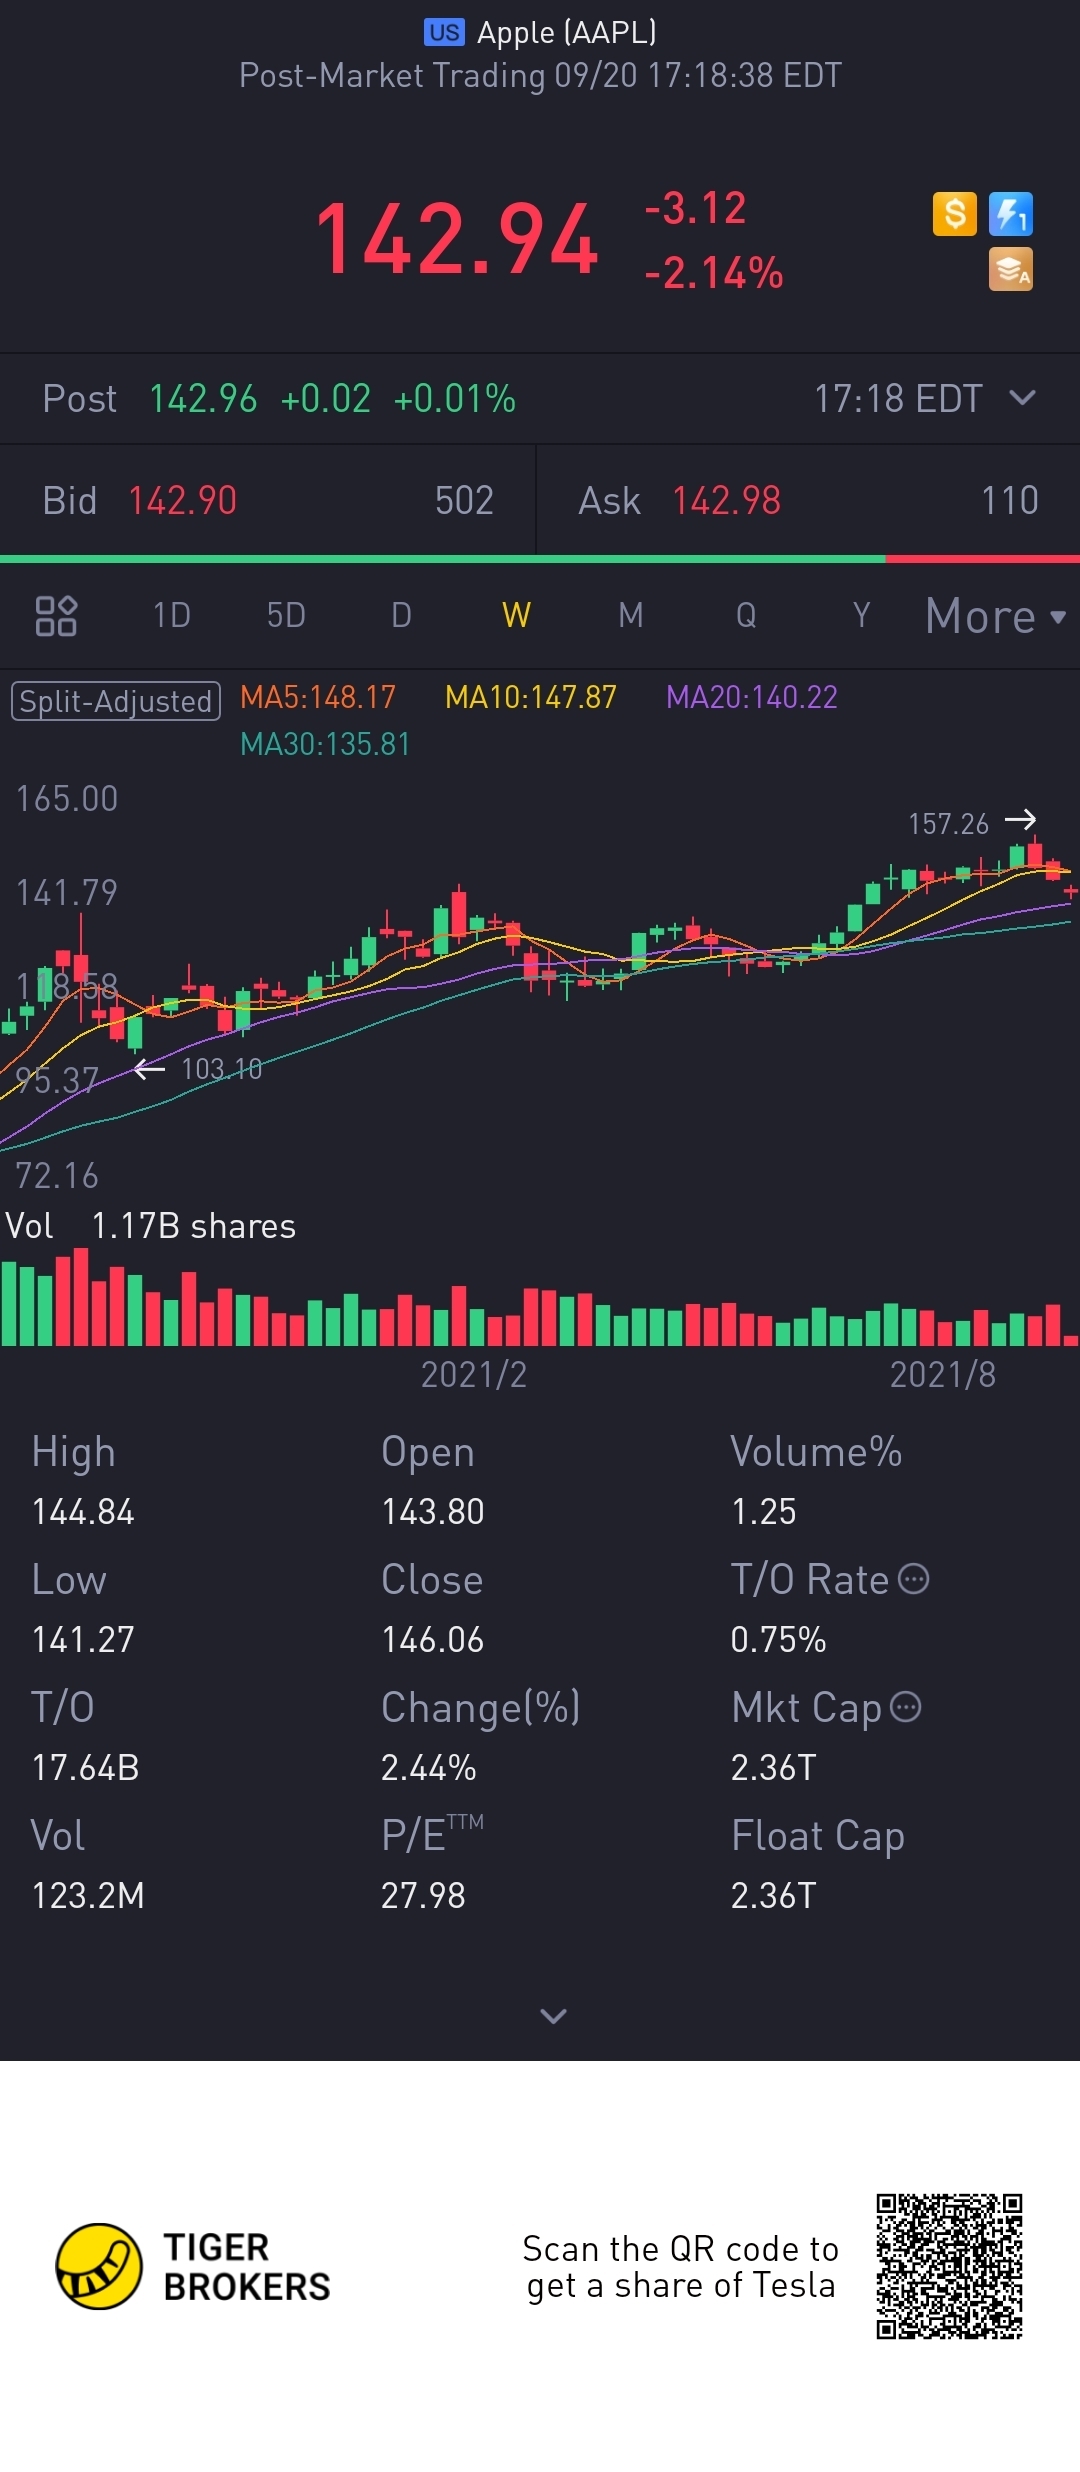
Currently, the price (142.94) is within one of the purple zone boxes & it has even broken through (lowest price closed today at 141.27).
This means that AAPL will get to the next bottom resistance.
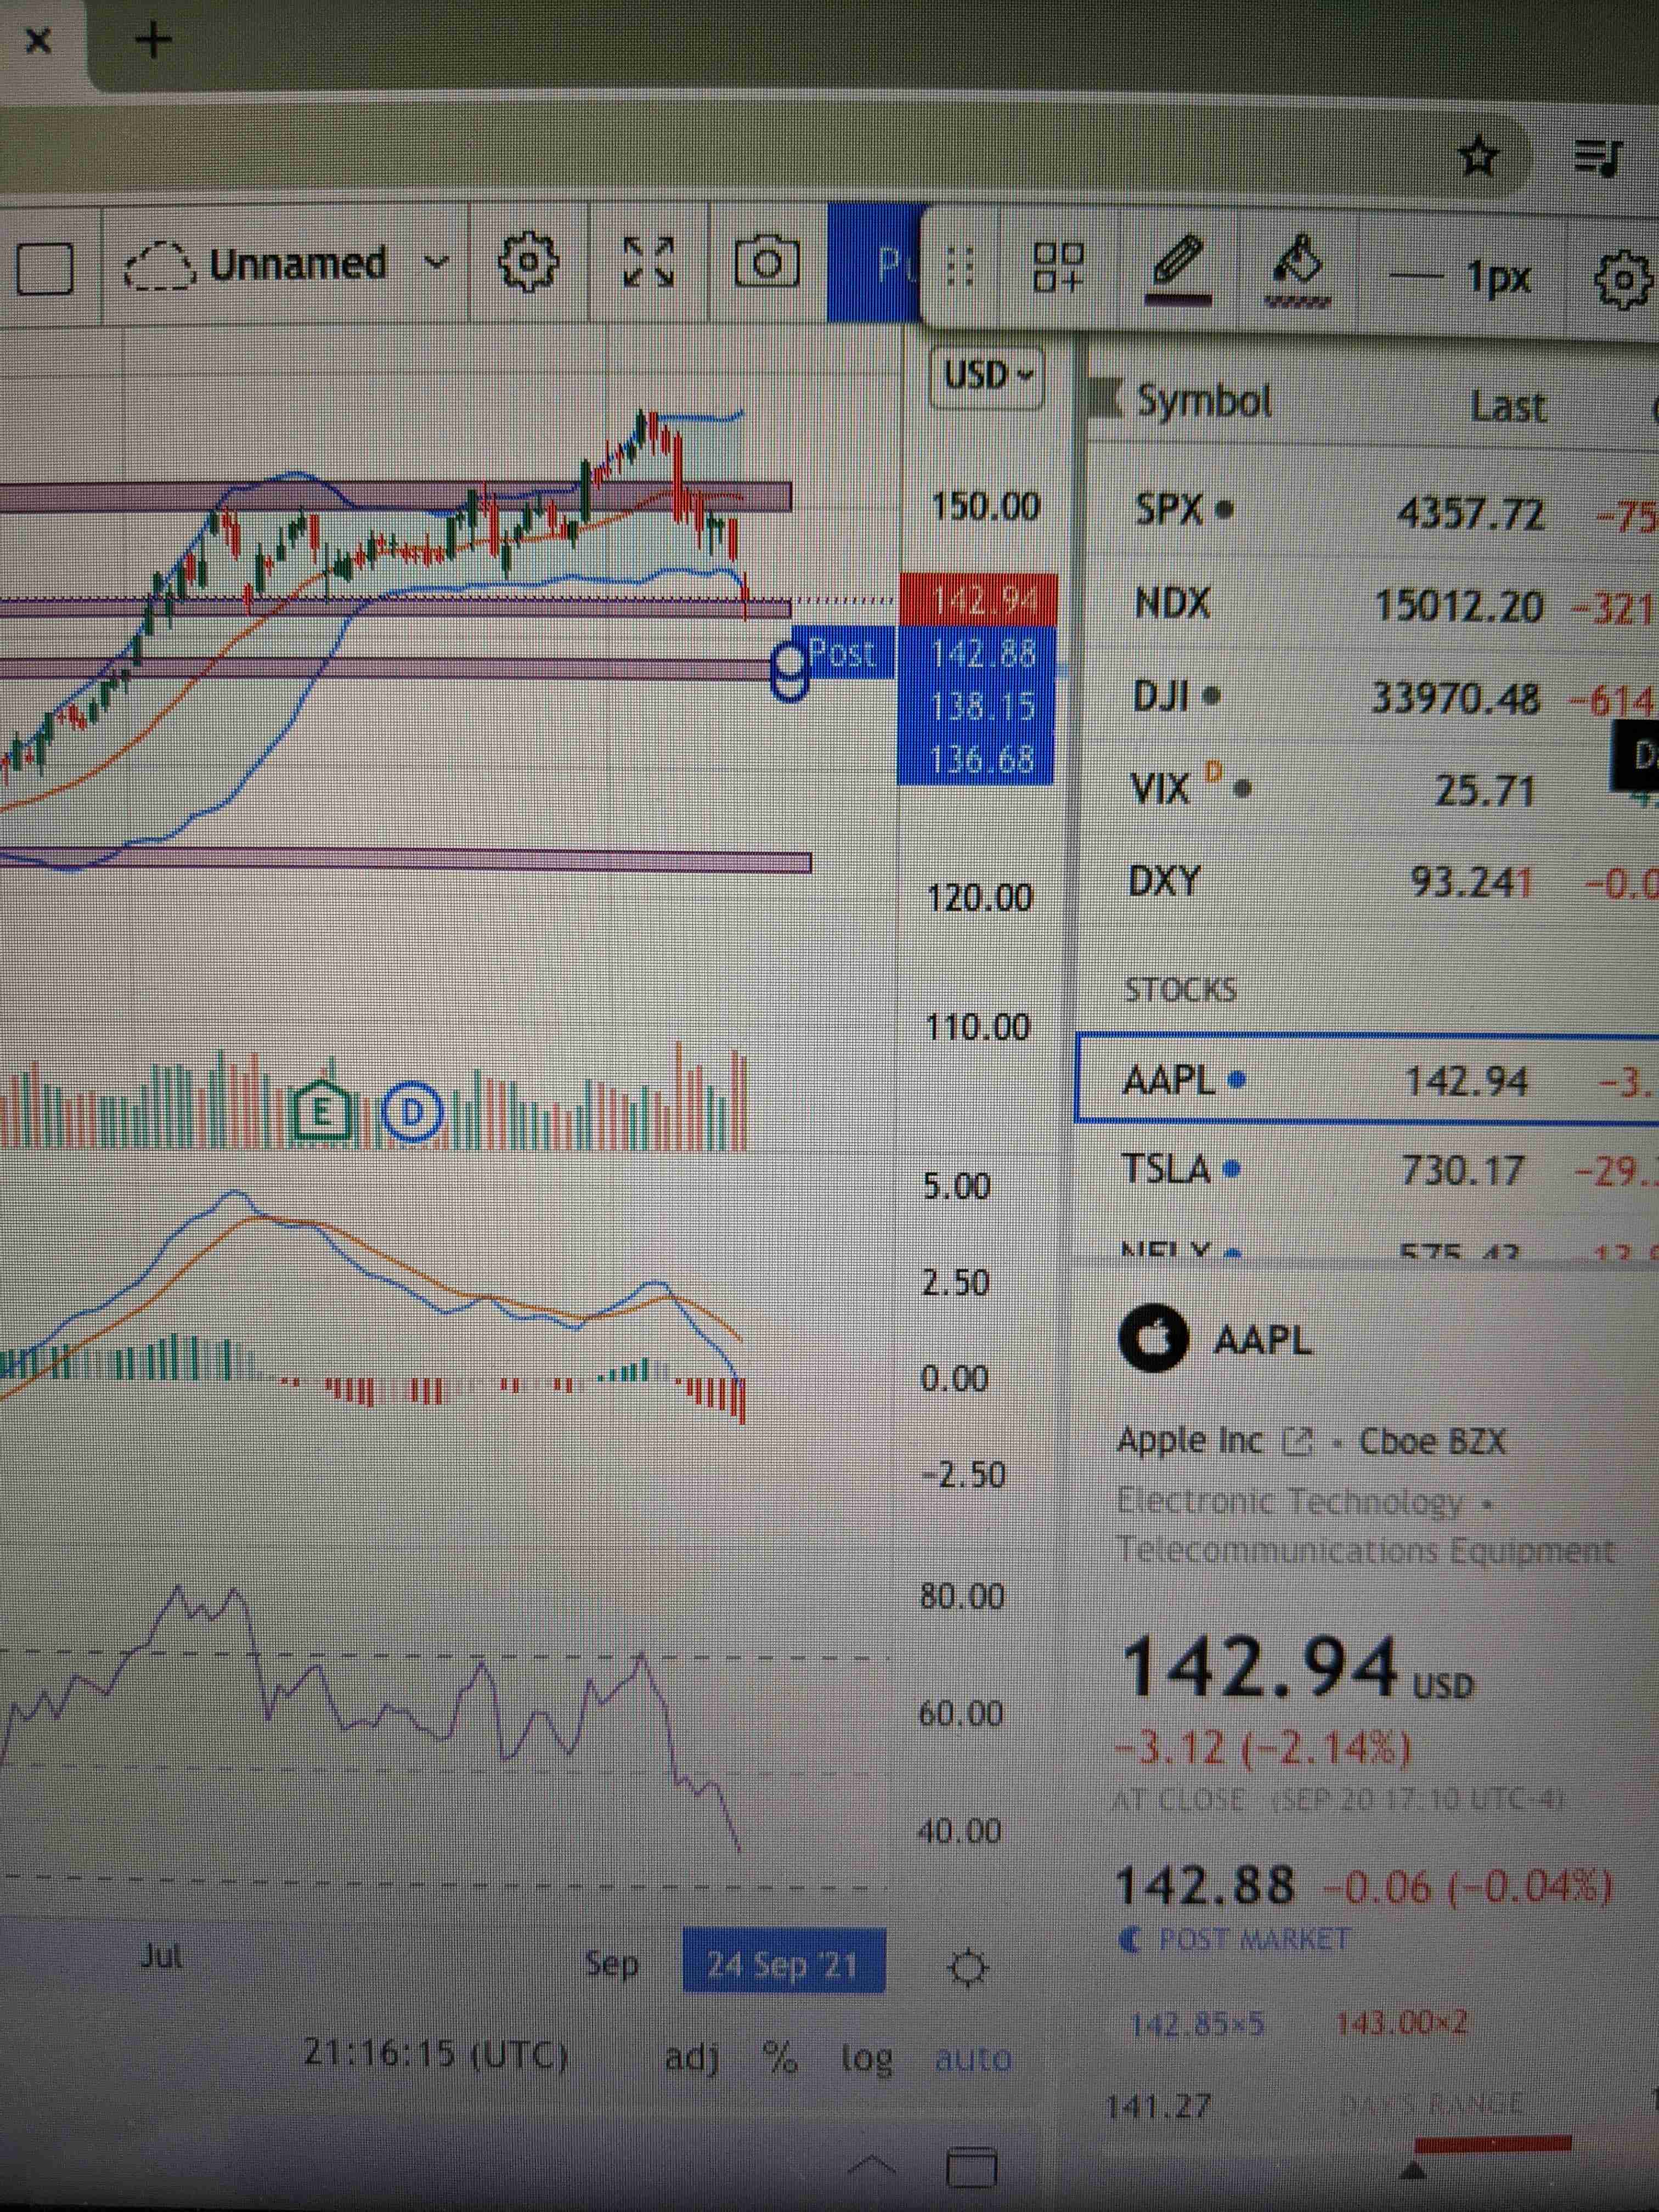
Just to be double certain that AAPL would break to the next bottom, I would add my 3 indicators of BB, MACD, RSI (you can refer to the 3rd picture).
And from there, you can see that the bottom of the bollinger bands is turning downwards; blue MACD is still diving (it has even gotten below the "zero" point of the Volume bars) ; RSI is diving with some space still to the bottom.
So for those who are still waiting on it to add position (including myself), looks like we need to look for the next bottom resistance zone.


精彩评论