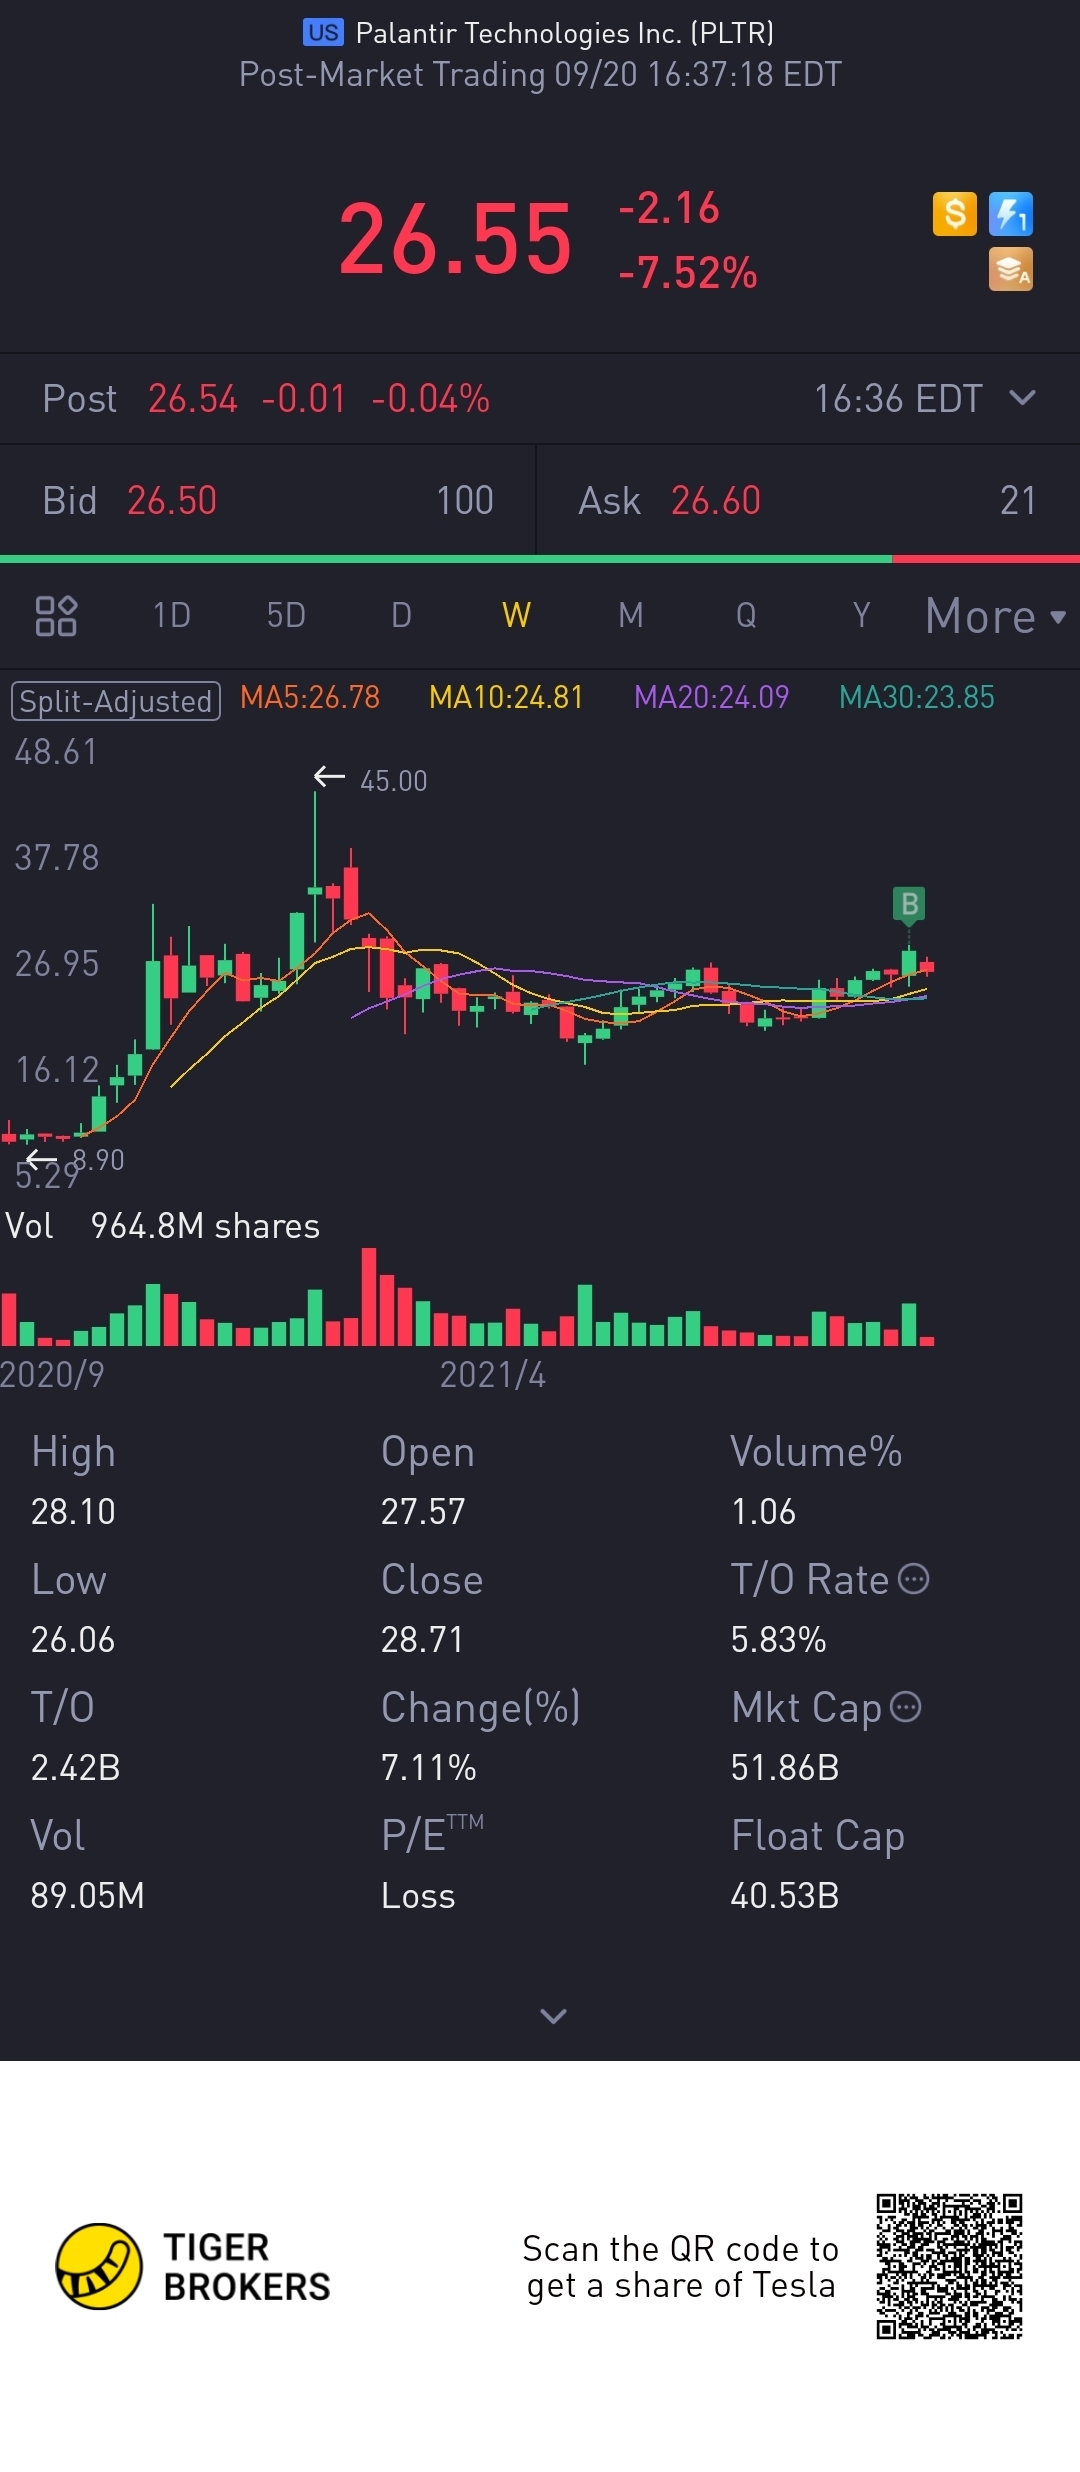
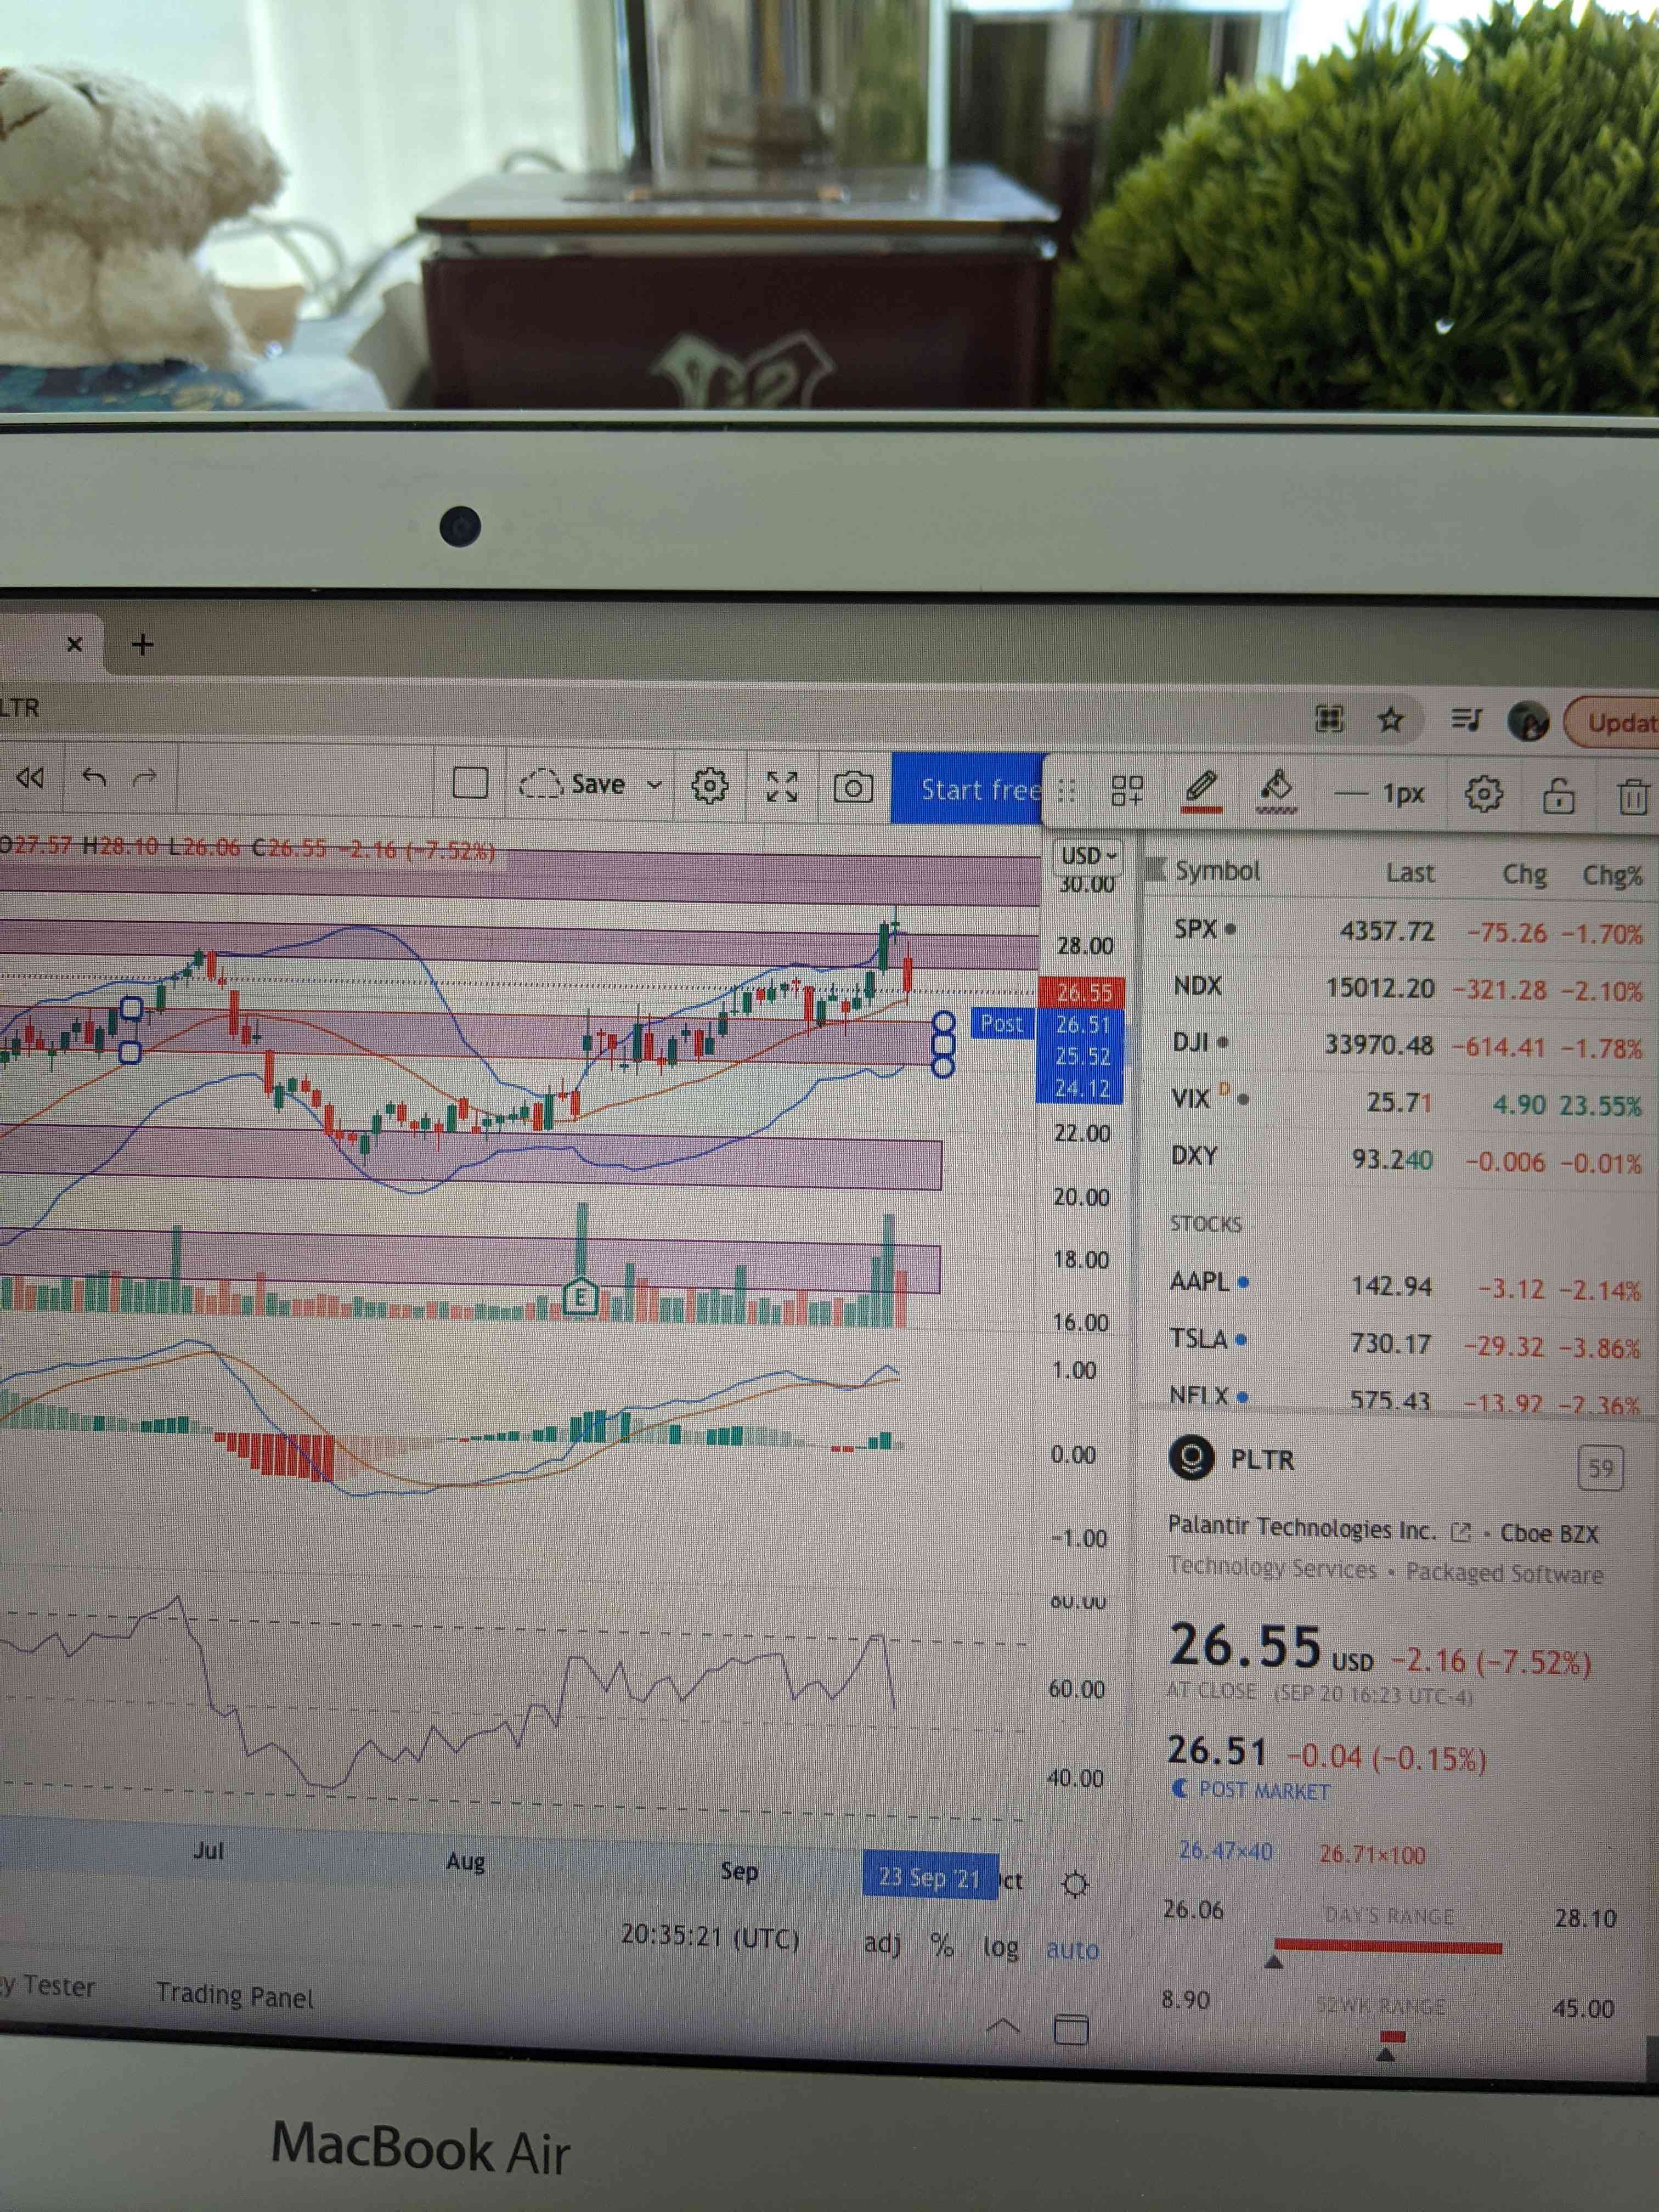
My support & resistance box drawing with $Palantir Technologies Inc.(PLTR)$
I just learnt that instead of drawing lines, it's much better to use boxes to do S & R analysis.
With boxes, it becomes an area/zone that is much clearer to see & no need to wait for the stock price to arrive at that "uncertain S/R line"
So below is how I interpret from support & resistance boxes for PLTR:
I have drawn 5 purple boxes, as you can see from the white chart.
As clearly shown, the price is hovering around 26.55
So, let's take the nearest two S & R rectangle boxes from that price -- which is the box at around 28.00 & the box below that.
The box below the current price of 26.55 has a zone between 24.12 (lower price of the band) & 26.51 (upper price of the band)
And for now, it is quite close to reaching this zone..
So beware, if the price enters this zone & breaks below the average price (25.52) in the zone..
I have to consider selling off this stock (if I decided to cut from holding this long term)
congratulations , you have just find picture,you can get 66 tiger coins after leaving a message in the comment area below this post"TIGER TO THE MOON", You also have chance to get 666 tiger coins and limited edition moon lamp.


精彩评论