During my first few articles that I wrote about $Apple(AAPL)$, I was sharing with the 3 indicators (MACD, Bollinger bands & RSI)
Now let us learn another simple analysis (Trend lines, with a few support and resistance zones)
For a more productive learning, you can open up AAPL chart as you read my article (I have been using tradingview.com since it's free & simple to use with many functionalities)
Once you open up AAPL chart, to get more accurate analysis do make sure that the date bar for the chart (usually found below or just on top of the chart itself is set to : 1Year "1Y")
1) TREND LINES
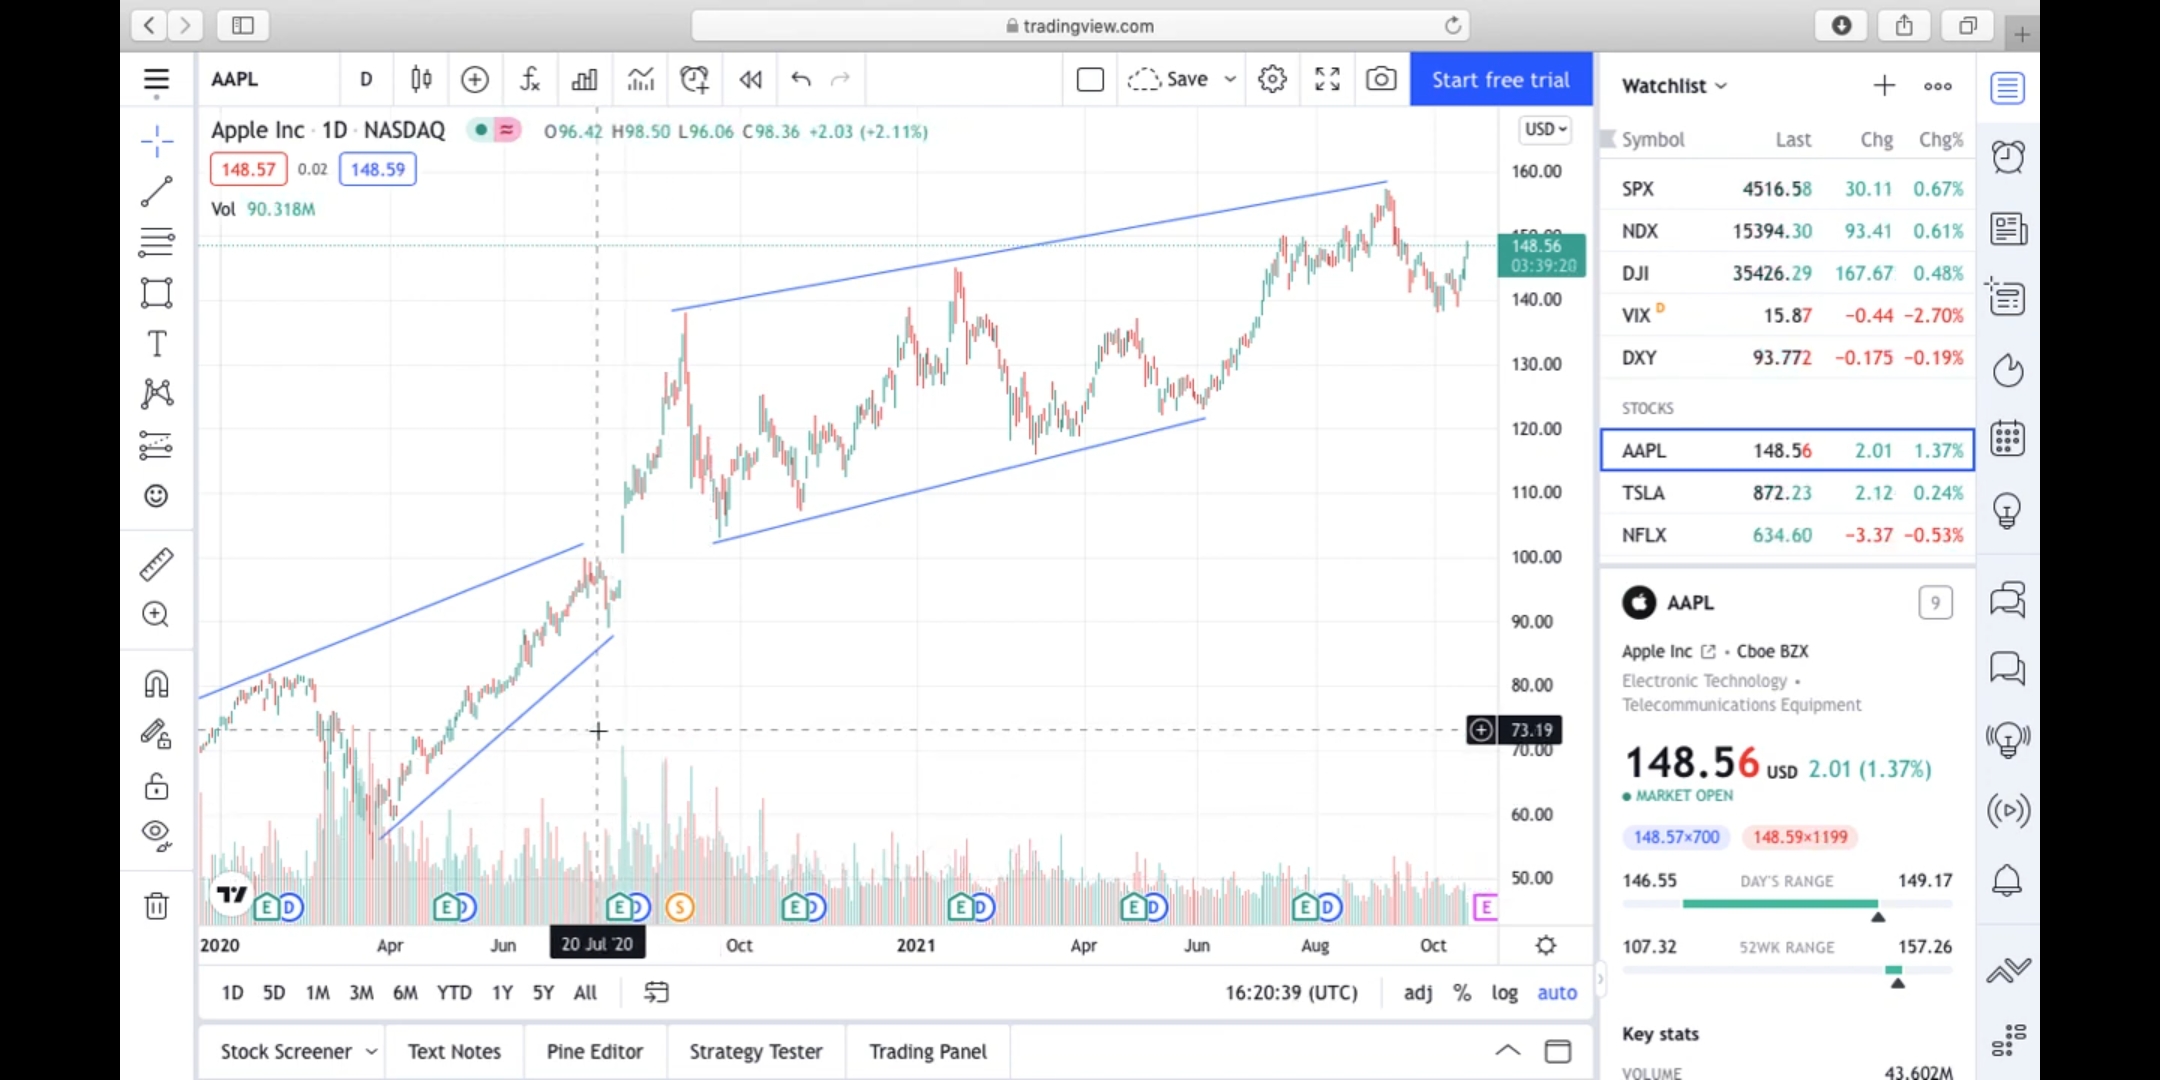
Click the LINE function on the drawing menu - draw the trend lines (As I have done here with those blue lines)
To do so, use the mouse cursor to trace point-to-point the top "obvious peaks" of the candle-sticks, followed by drawing the "obvious bottoms".
Note when drawing, u can break up the lines traced so that u can compare the trends. (You can draw more than 2 sets, however for simple comparison, just 2 sets of trend lines is good enough)
Once done, it should be similar to the image above [微笑]
ANALYSIS:
So you can see that the set of trend lines (on the left) shows a steeper slope up while the current trend line (on the right) isn't that steep as the one before. That means the growth for $Apple(AAPL)$is currently slowing down.
2) SUPPORT & RESISTANCE ZONES
This is another powerful method for analysis.. Once you know how to draw, you could achieve x2 better prediction with the stock prices [微笑]
For the trend lines, I mentioned about drawing the more "obvious peaks" & "obvious bottoms".
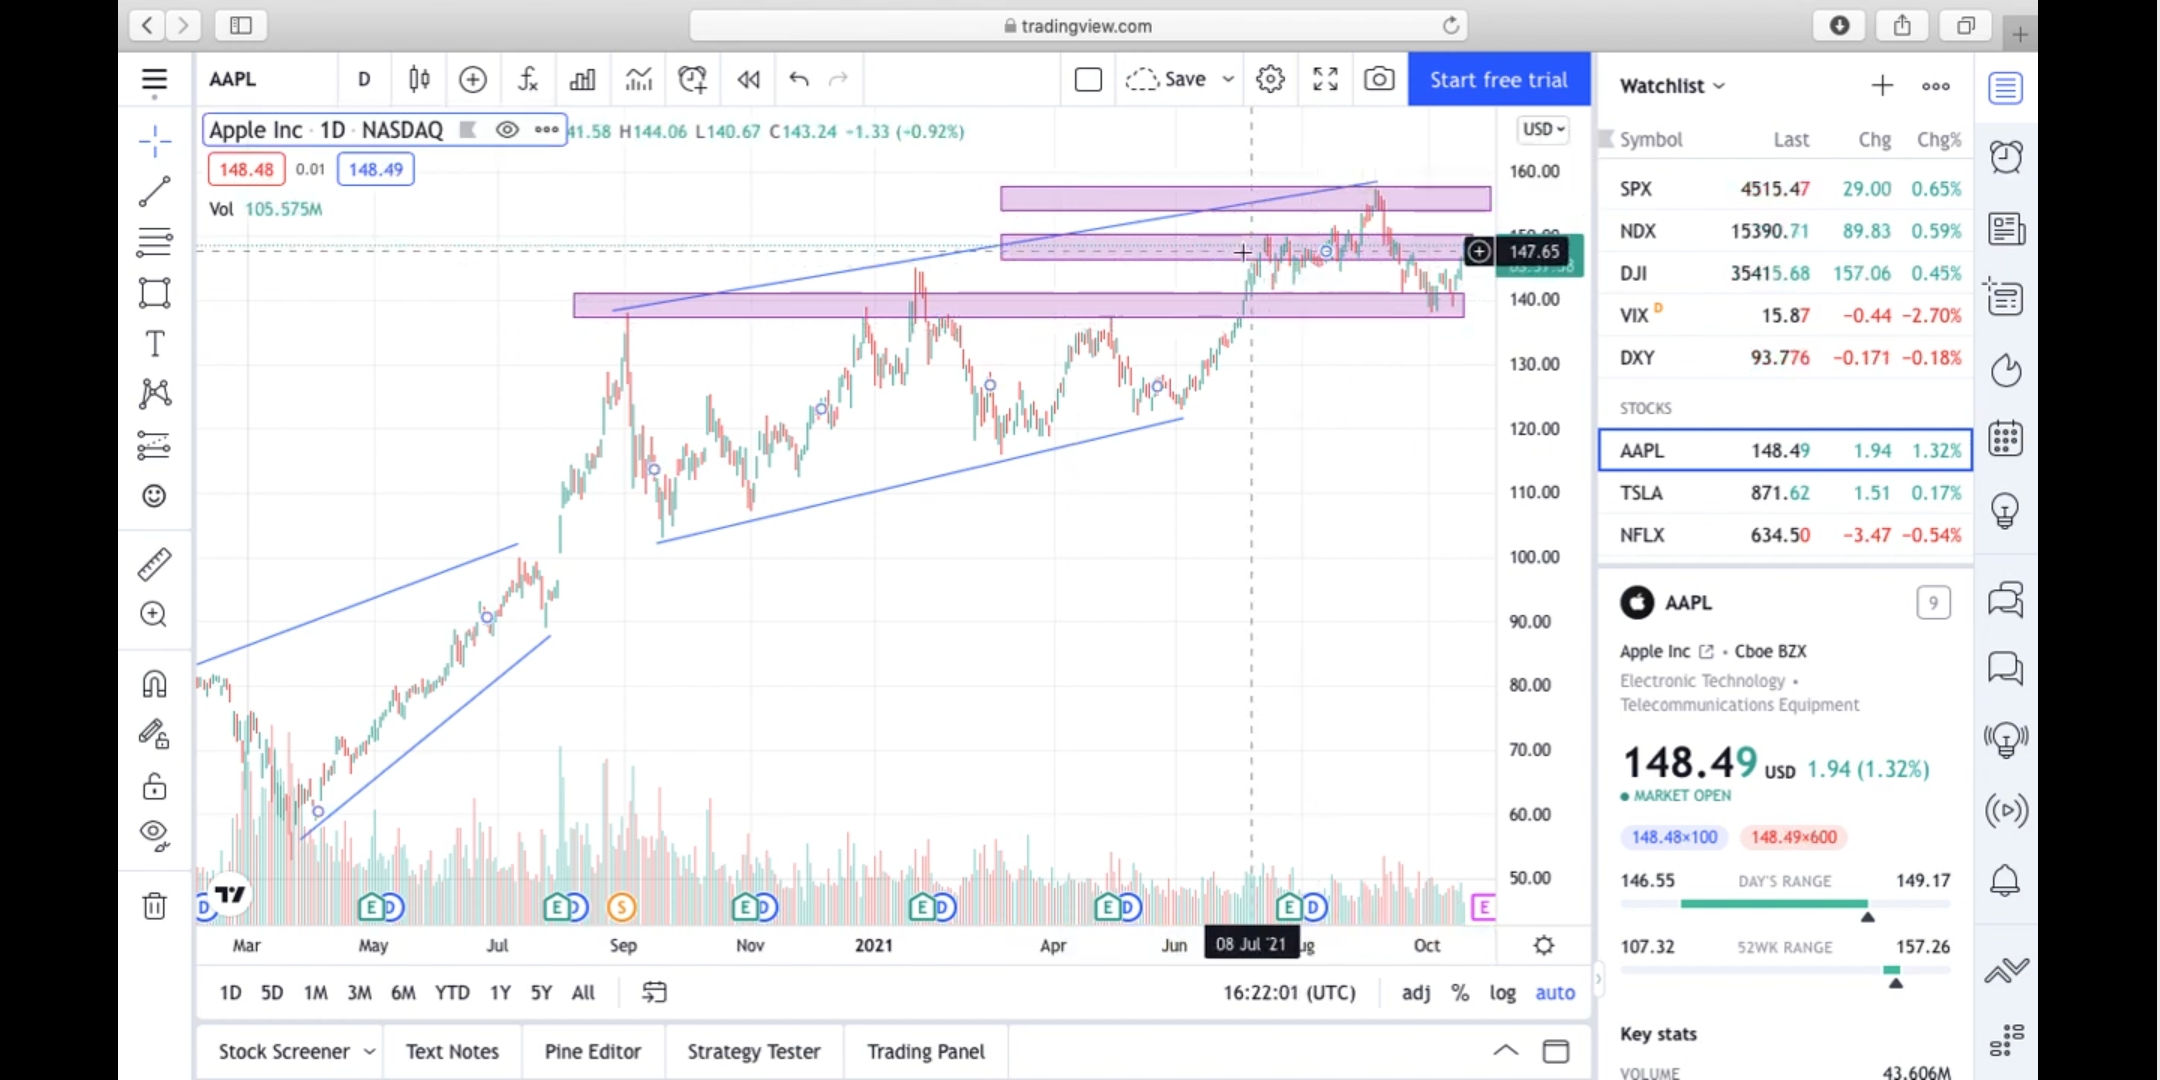
Now for S & R zones, it would be horizontal rectangles (also available on the drawing menu) across the "obvious peaks" & "obvious bottoms".
And these "obvious peaks" & "obvious bottoms" on the S & R zones would usually cover over past history of "obvious peaks" & "obvious bottoms" as well.
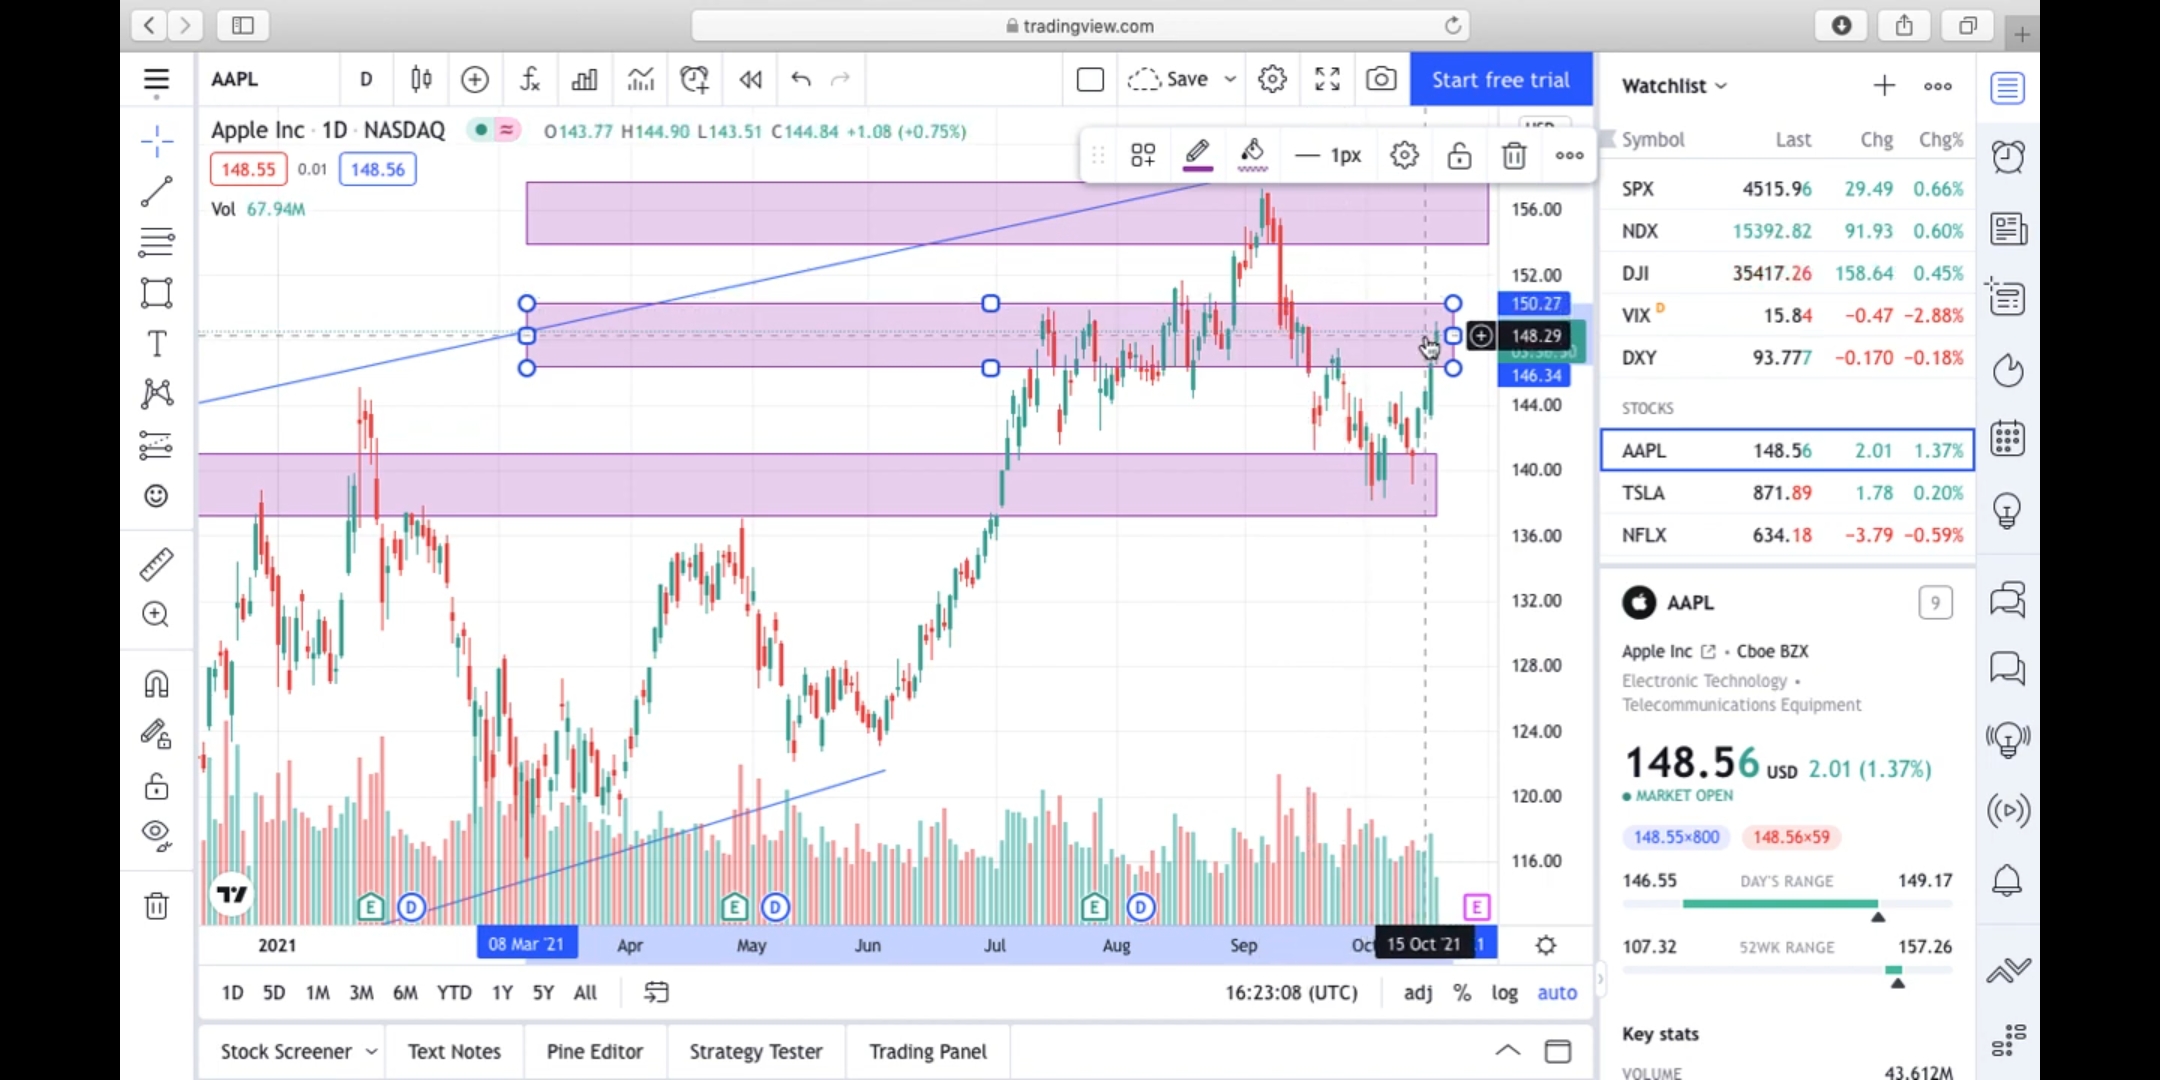
I have included a zoomed-in image, hope you can see better what it looks like.
ANALYSIS:
Looking at the top zoomed-in image, notice that the price of $Apple(AAPL)$ has arrived at the 2nd-top zone.
If the share price breaks above current 2nd-top zone during the next market open hours.. that most likely mean that it will be going for the next (top) level..
If it did not break above the 2nd-top zone, it will sink back downwards to the 3rd zone below.
So do keep a look-out for its potential, especially when AAPL's Earnings will be announced soon (October 28 - US time), followed by Dividends where share price will likely drop.
精彩评论