Background
• In my 1st Post in B/May after their Q121 Results, I posted on why their IV is 1.3 x NAV
• In my 2nd Post in B/Aug after their Q221 Results, I posted on why their IV may be as high as 1.435 x NAV
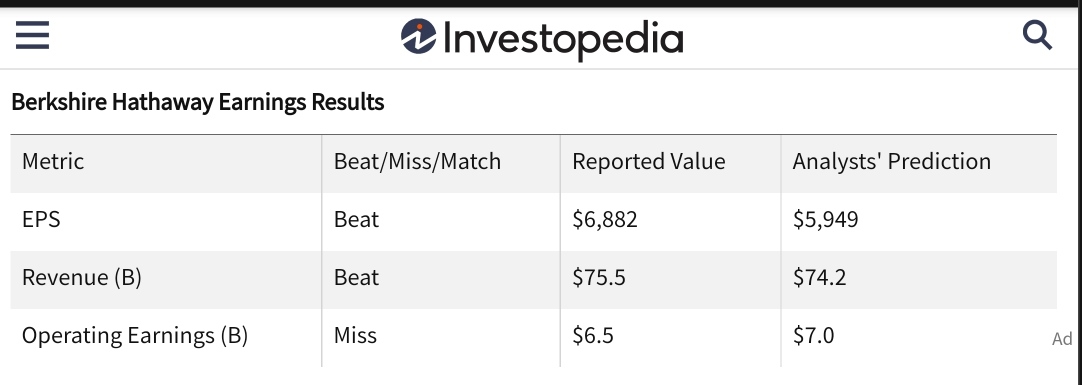
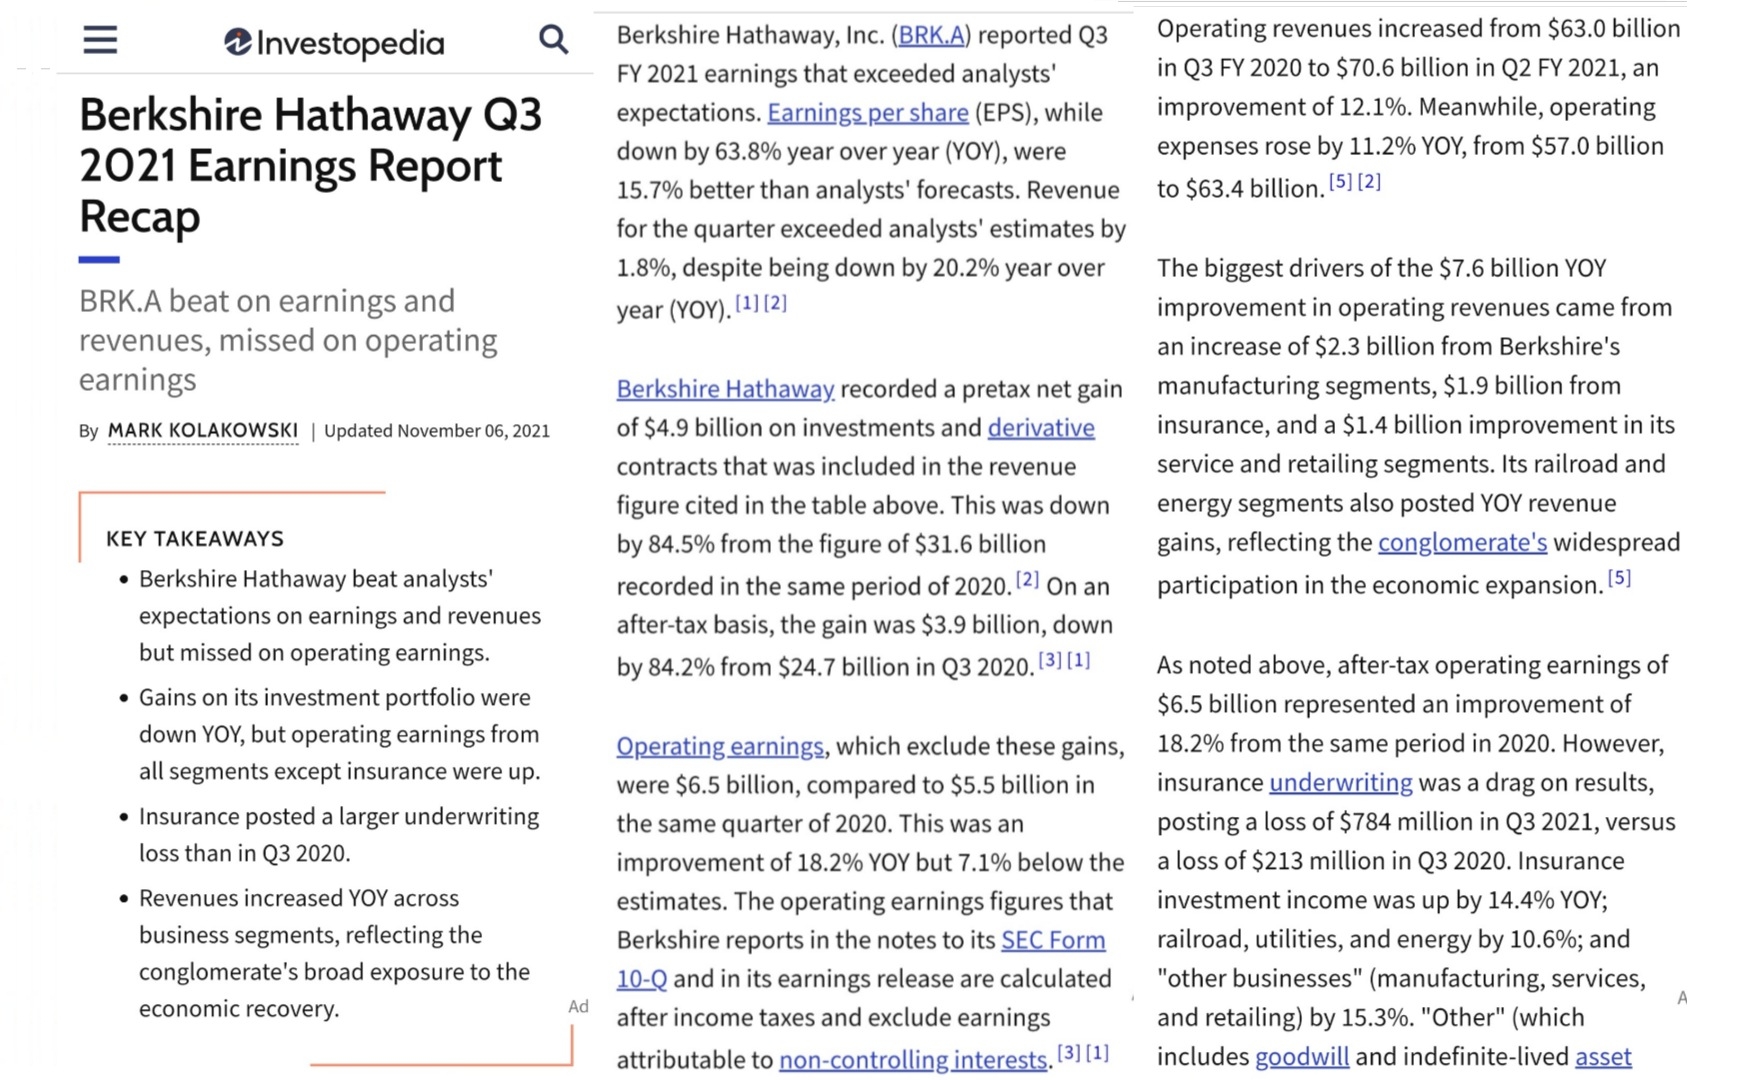
• With Q321 Results just announced, this post will expand on this topic
Q321 Results
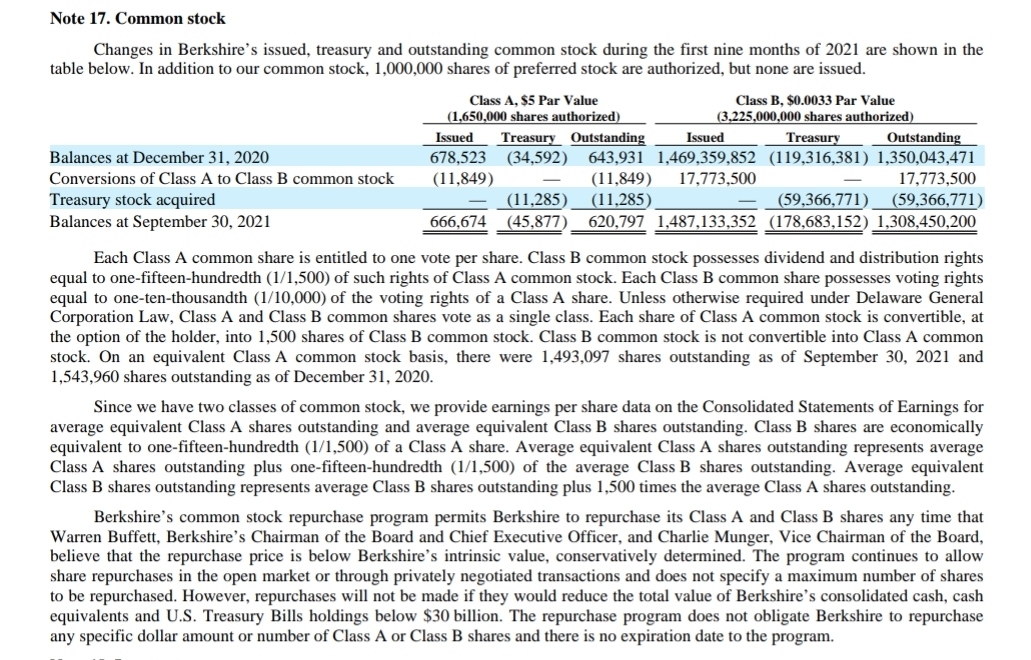
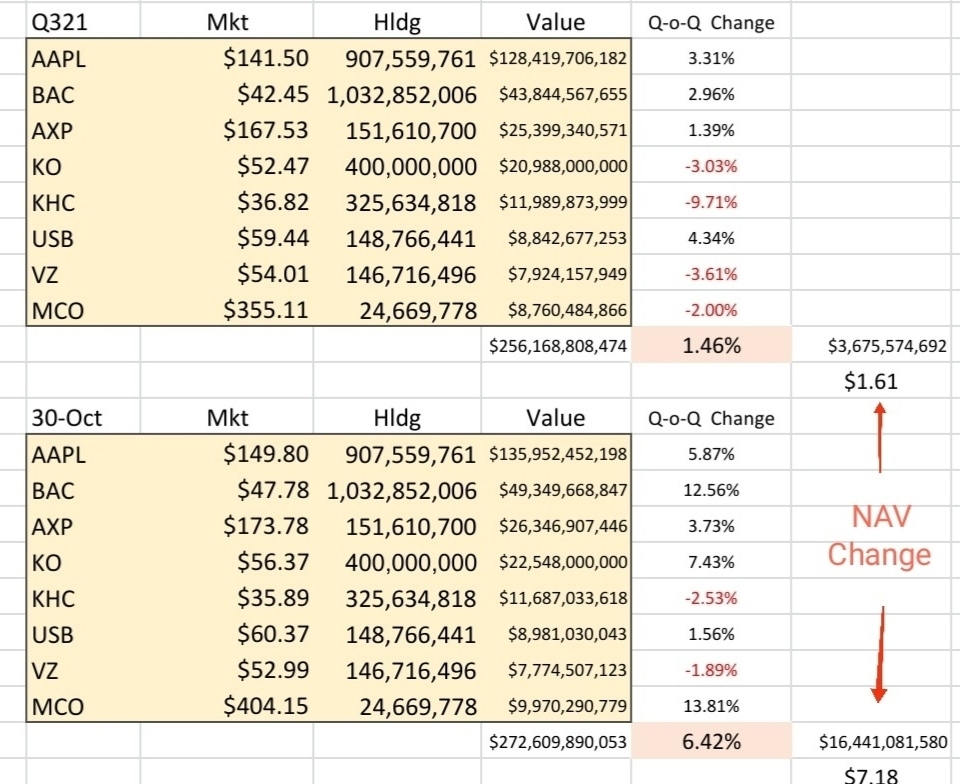
Figures for Computing NAV
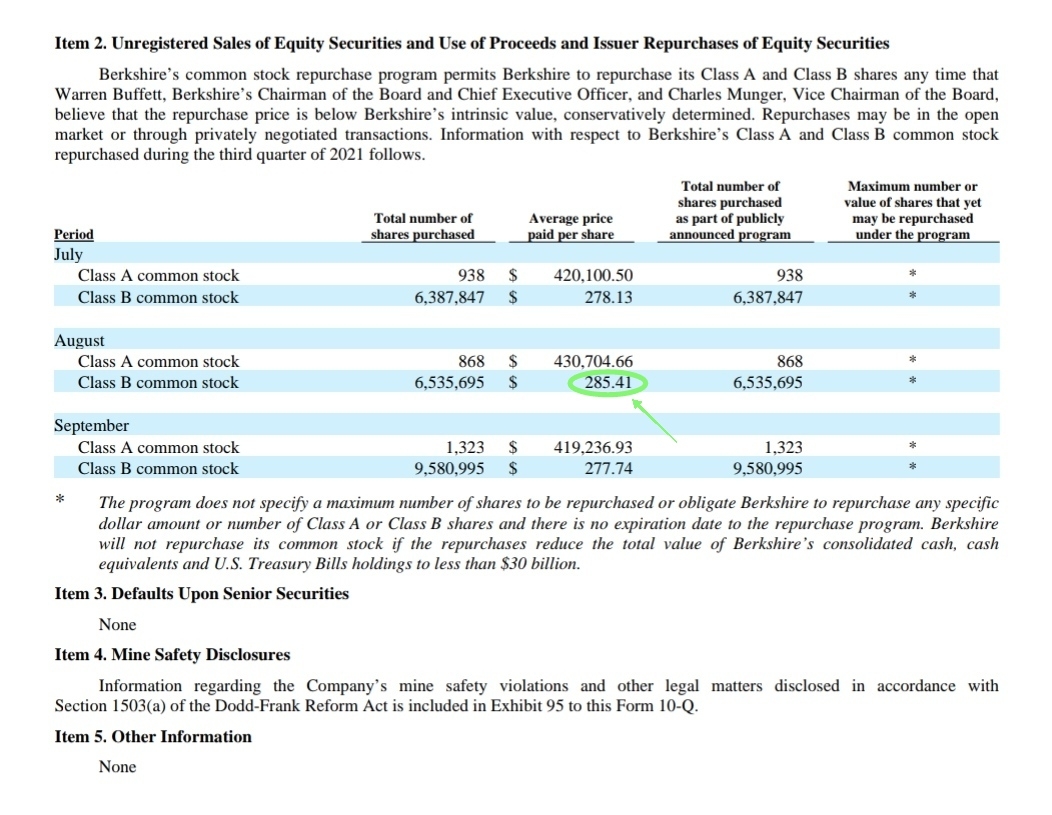
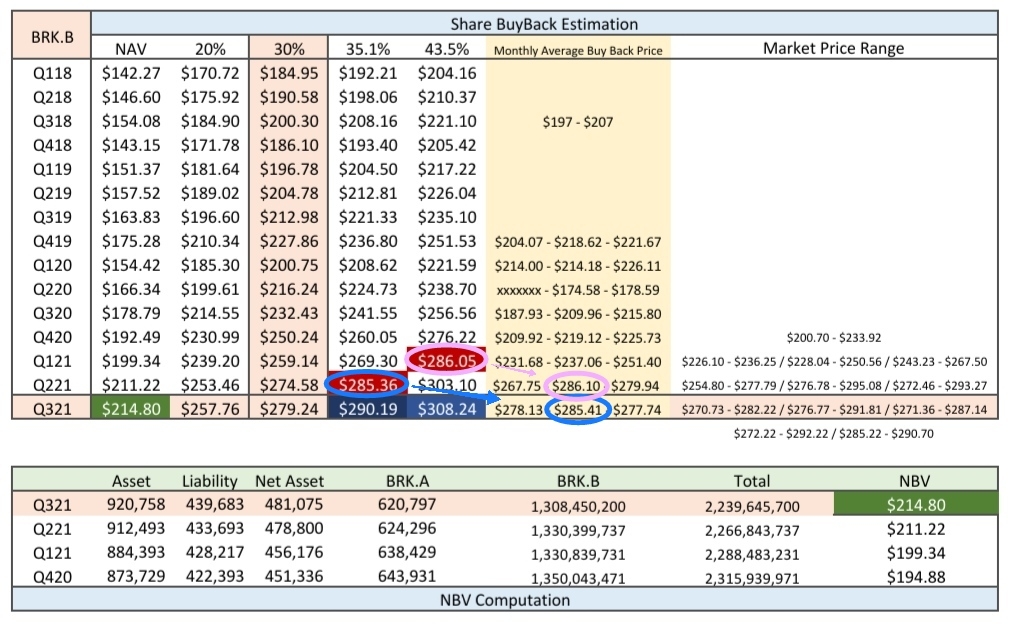
Shares BuyBack for Q321
Compilation & Computation
Observations
•This is the 2nd Consecutive Q where their Average Monthly Share Buyback Price is Higher than my Original 1.3 x NAV Estimate.
---> Not as High as 1.435 x NAV for Q221 but still 1.351 x NAV for Q321.
• Useful Reference Prices in Q421 for me,
---> $279.24 (1.3x) - For BUY, up to this price
---> $290.19 (1.351x) - For SELL, around this price onwards
---> Prices between this range - Buy / Sell depending on Individual Objectives
• NAV Increased by $3.58
---> My Est was +$1.61 Using Top 8 Investment Stocks
---> This means ~1/2 of NAV Gain Due to Core Biz
---> End-Oct NAV Increase from Stock Investments is +$7.18
------> Monitor Closely for end-Dec to see if Good +ve Maintained
Disclaimer
DYODD
精彩评论