
When the Fed hikes 75bp this week, it will take policy rates to a neutral-ish 2.25-2.5%. Thus moves at subsequent meetings will deliver a restrictive setting, and then either the Fed’s hoped-for softlanding or the mildrecession that seems to have become the analyst/investor consens.
I say that mild recession has become consensus for two reasons: (1) this term dominates alternatives like “severe”, “long” or “deep” in sell-side research and market commentary; and (2) market valuations like
Equity PEs and Credit spreads were, at their worst points this summer, only consistent with minimal economic contractions.
This modal view of mild recession often comes from recognition that US household & corporate balancesheets look strong compared to typical, pre-recession deterioration. For example, the increase in private sector leverage in the 5 years before the start of a recession was 10% of GDP for the 1990 episode, 11% for 2001 and 20% pre GlobalFinancialCrisis. For the current expansion, private sector debt-to-GDP has been declining and is almost unchanged from 2019.
What this debt focus misses is that the length and depth of the next recession won’t be determined by how long private sector agents require to strengthen balance sheets (i.e. increase their savingsrates). Instead, duration and amplitude will be determined by how long the Fed needs to maintain restrictive policy to reduce corePCEinflation to near 2%. This is the proverbial GrowthSacrifice. The template for such trade-offs comes from recessions of the 1970s & 80s, not those of the past 30 years that inform some baselines.
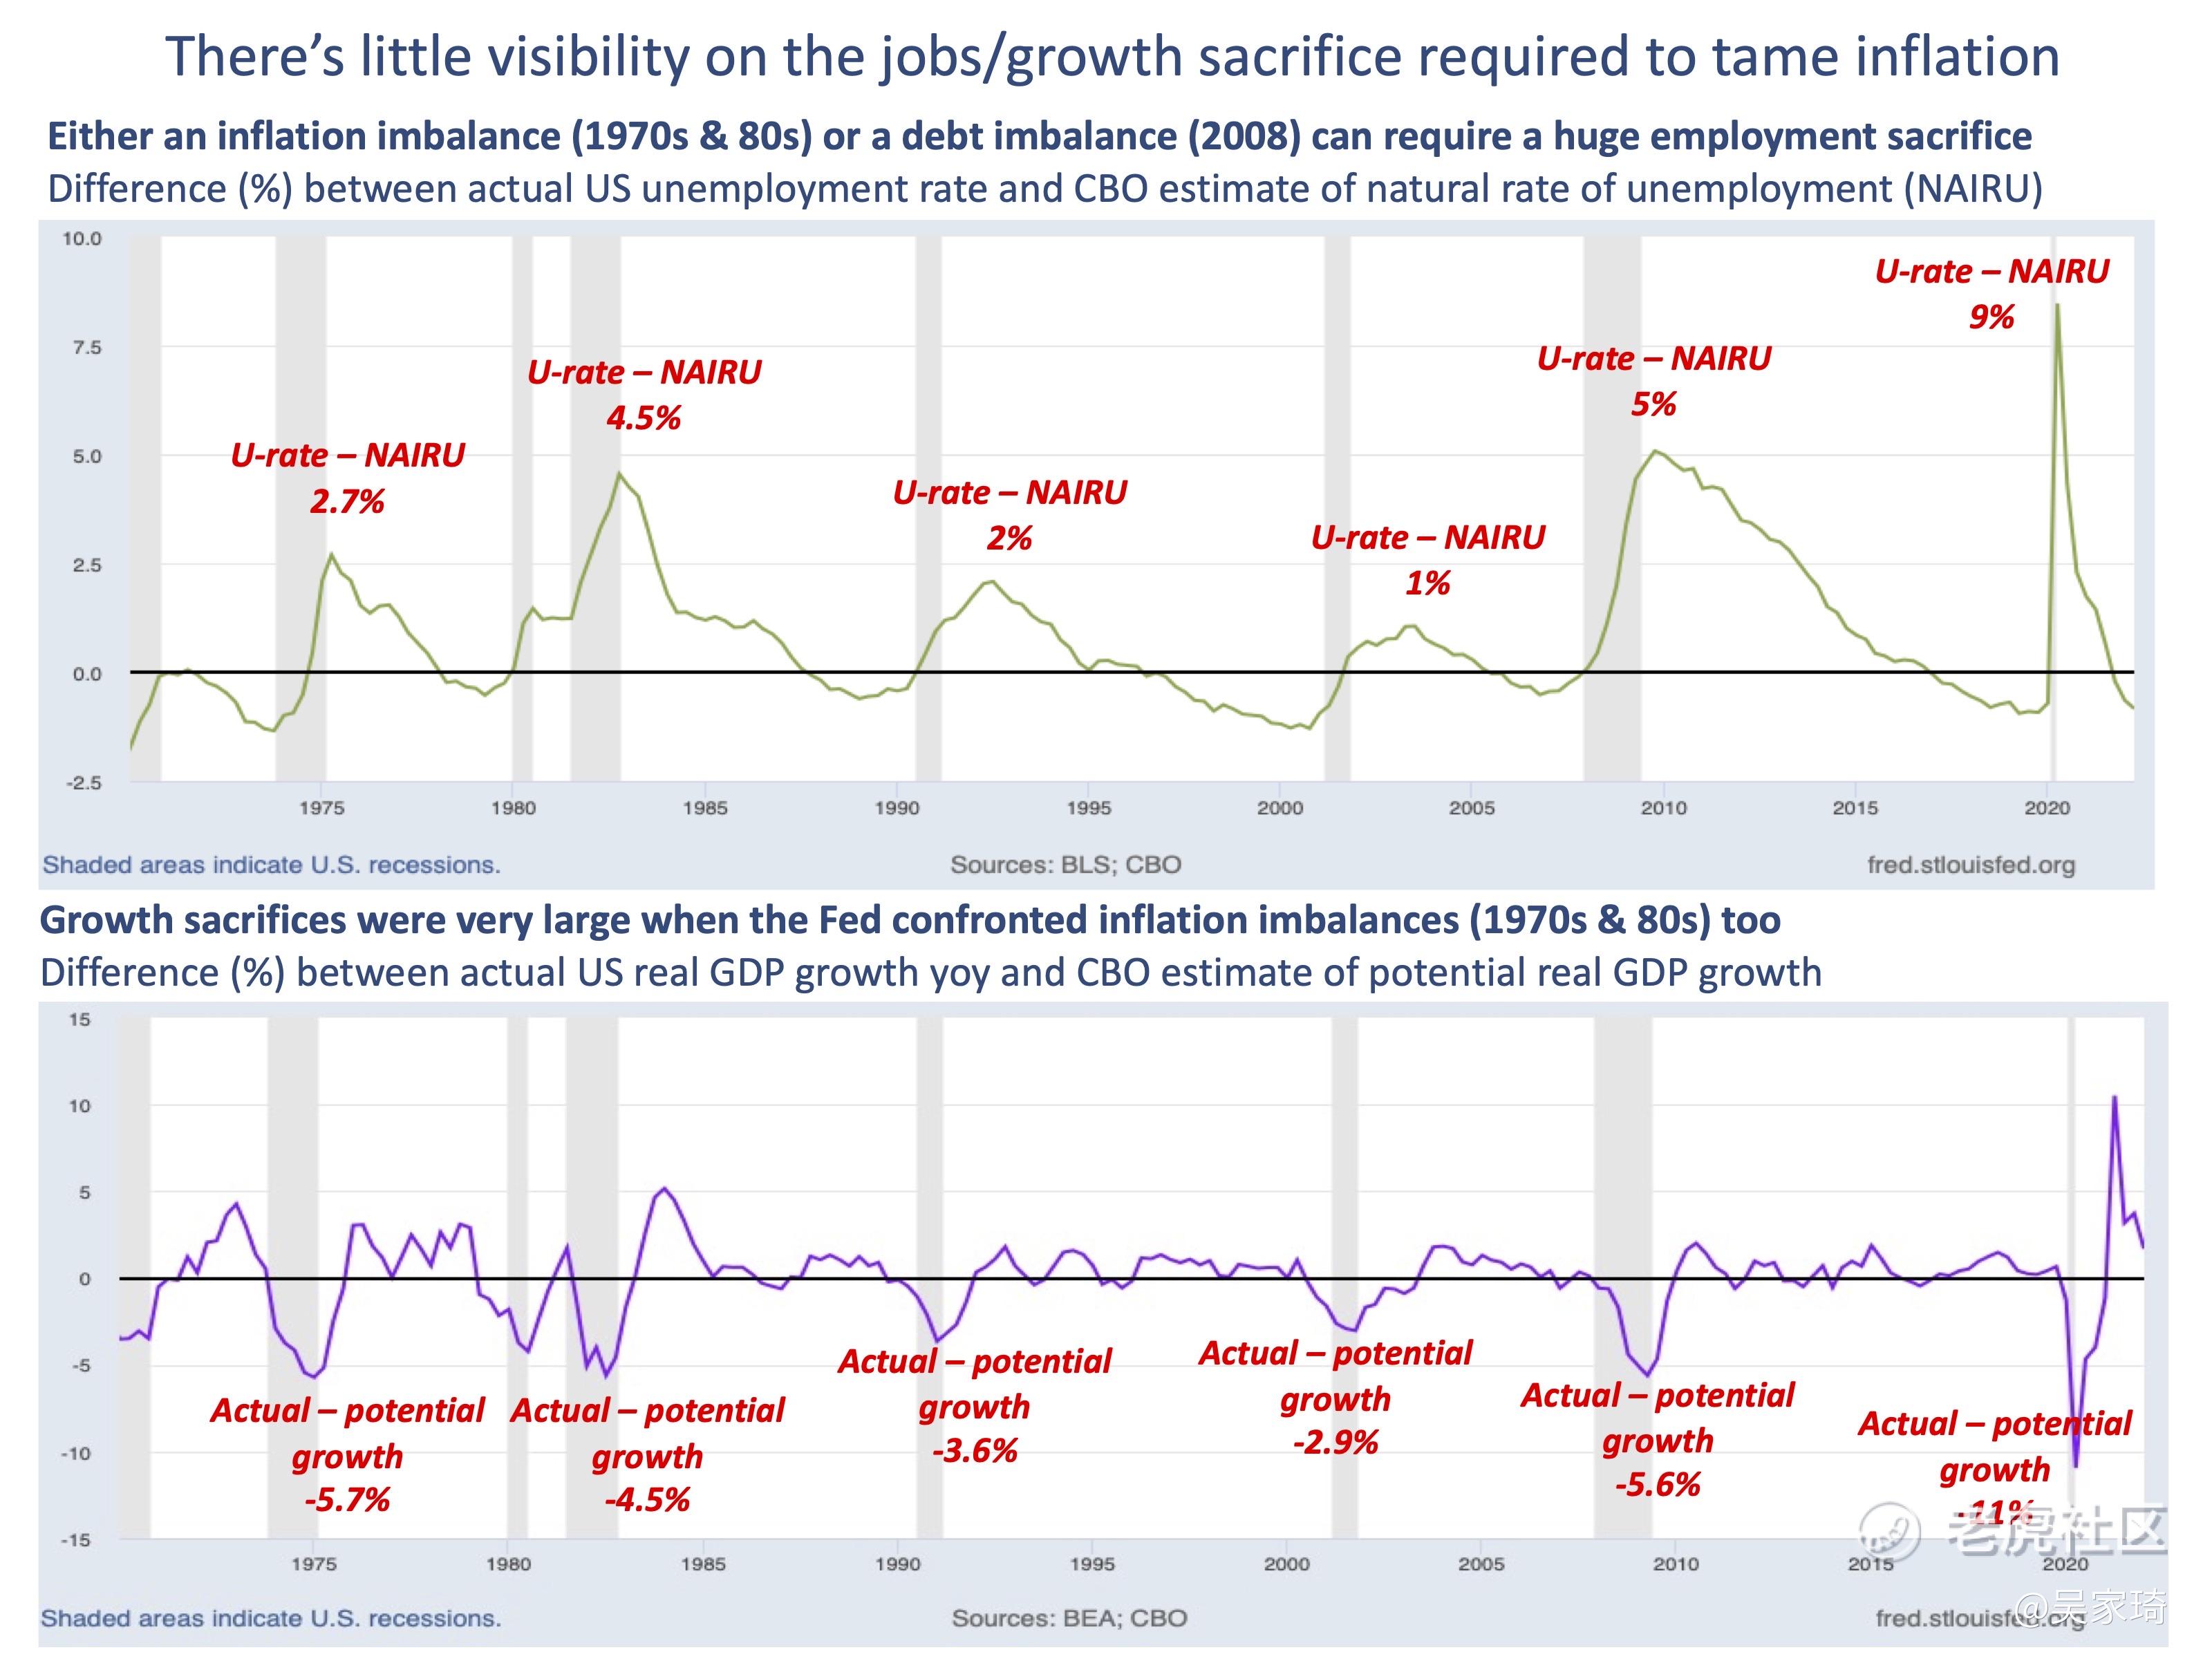
The graphs below show that growthsacrifices can be just as large with excess inflation as with excess debt. The top chart plots the difference between the US unemployment rate and the NAIRU, as a proxy for the labor market adjustment required to correct for too much inflation (1970s, early 1980s) or too much debt (GFC). Yes, the balance sheet recession of 2008 delivered the biggest hit to employment, but the JobsSacrifice of the 1973 and 1981 episodes were severe too (2.7% & 4.5%, respectively)
The bottom graph plots the difference between US real GDP growth and potential, as one of several possible ways to illustrate the required rebalancing. The output loss relative to potential was huge during the GFC (-5.6%), due to private sector over-indebtedness. But note the shortfalls in the 1970s & 1980s as the Fed confronted high inflation: those too were near -5%.
A key difference between the 1970s/80s and now is that core is running only half as hot (10% vs 4.6%). Hence there isn’t much reason to expect sacrifices to be as large as 40 years ago. But even leaving out those extremes, there seems to be decent scope for the next recession to be worse than the mild one modelled on inappropriate templates like 1990 & 2001.
精彩评论