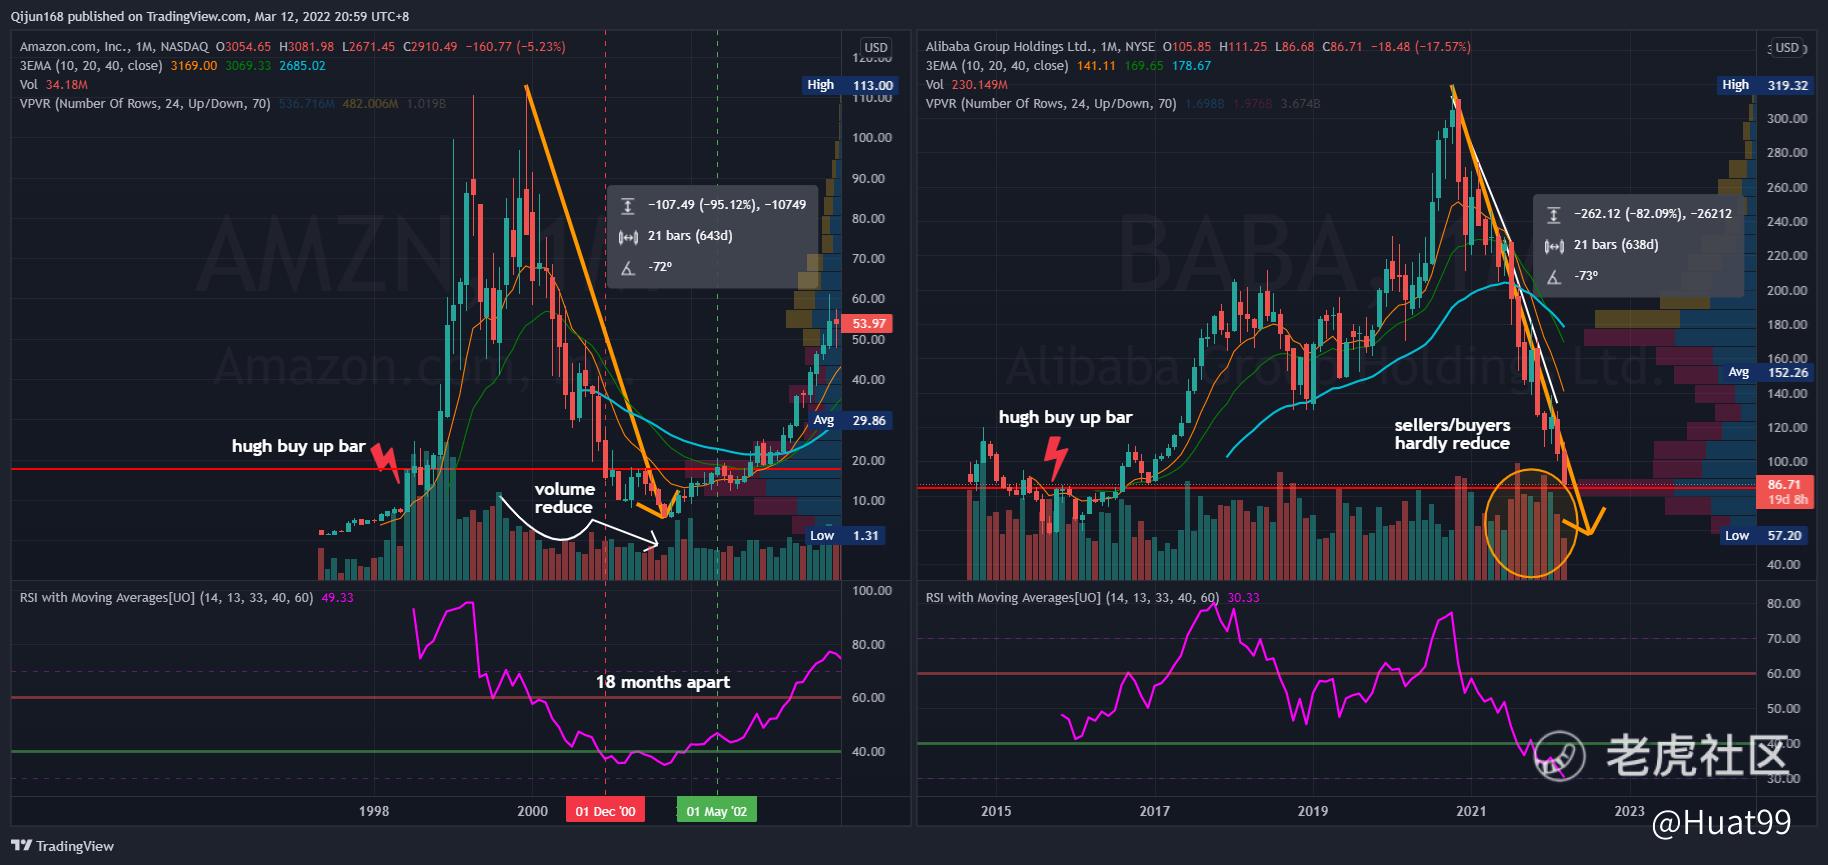
$Amazon.com(AMZN)$ vs BABA monthly chart
1. AMZN worst drop in history, gone below 70% POC to low of Hugh buy UP bar as shown
2. can observe AMZN volume largely reduced after Dec 2000, you can view as sellers dry up or buyers lost interest in this stock
3. it took 10 months! YES! RSI stays below 40 for 10 long months! for AMZN to finally confirm the bottom! (note that RSI did not dip much further, just dragging below 40)
now back to BABA
1. BABA is right along POC ! but look at the volume.. hardly reduced, you can view as sellers in full control (red candles size are bigger than green candles) OR there is too much "hope" in this stock (media coverage, fun manager giving all the BUY hope)
2. there is also a Hugh buy UP bar back in Oct 2015, so this is where there is a high chance BABA is going to test towards the low of this bar
4. even though it has been months RSI stays below 40, the problem is it went deeper low!
now how long to recover back along POC?
example from AMZN, it took 18 months! from the initial month RSI drop below 40
this is assume BABA continues to drop way below POC like AMZN
ok ok, can we really do such comparison?
AMZN at that time is still loss making (not sure right or not)
BABA now is profitable! cash rich! business continues to grow!
After all, this is how the chart is telling me
side note, what is POC of Volume Profile (RED horizontal line)?
https://www.tradingview.com/support/solutions/43000502040-volume-profile/
精彩评论