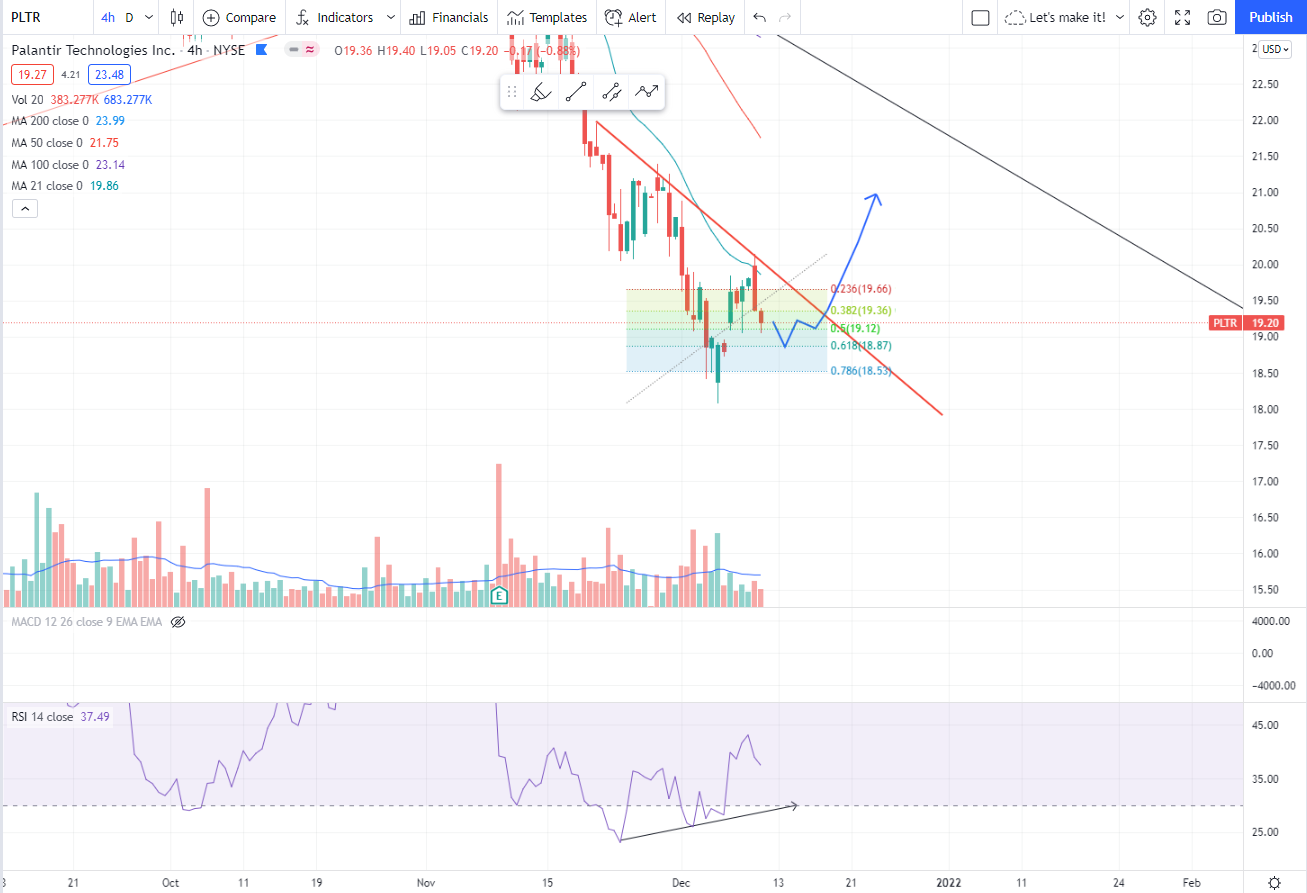
The chart is showing the 4Hours timeframe.
The first thing to notice is that the relative strenght index is making higher lows, while the prices have been making lower lows. This is a sign of possible bullish divergence, as the drop of the prices is not confirmed by the strenght of the sellers, which is decreasing. I would expect today a further drop toward the 61.8 Fibonacci level of the most recent up leg, at 18.87$ approx. From that level prices might rebounce again, trying to attack the red downtrend line and trying a breakout, atatcking again the 21$. I personally to not believe that prices might reach the 17$, but of course this is just a personal opinion and study. I am not financial advisor.$Palantir Technologies Inc.(PLTR)$

精彩评论