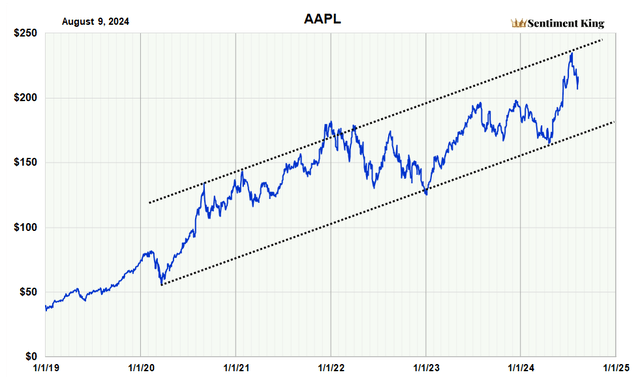
$苹果(AAPL)$ 从2019年至今的股价图表分析中,我们观察到苹果公司股价持续在上升通道内稳健运行。特别是在4月至7月期间,股价在触及关键支撑位后,展现出了强劲的反弹势头。然而,近期股价在接近历史阻力位时出现了冲高回落的现象,这可能预示着短期内的调整压力正在增大。
 A graph showing a line graph Description automatically generated with medium confidence
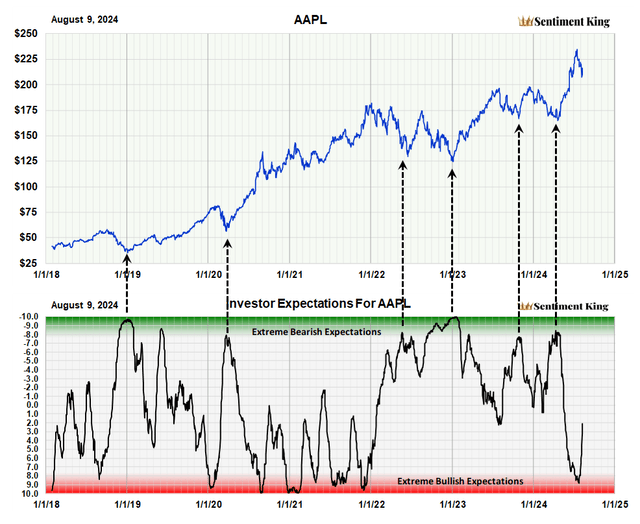
投资者信心指数的历史数据揭示了一个有趣的现象:苹果股价的大幅上涨往往始于市场普遍持有的负面或看跌预期,这恰恰印证了巴菲特的投资哲学——'在别人贪婪时我恐惧,在别人恐惧时我贪婪'。当前的指标显示,市场对苹果的预期仍然偏向乐观,这可能需要我们保持警惕,以避免在市场情绪过于一致时做出非理性决策。
 A graph of stock prices Description automatically generated
布林带指标为我们提供了进一步的信号,表明苹果股价可能面临回调。在4月至6月期间,股价的显著上涨导致其触及布林带的上轨(通常以红色表示)。根据历史模式,这种情况往往预示着在未来三到六个月内,股价可能会经历显著的价格调整或时间上的盘整,以回归至布林带的下轨(通常以绿色表示),从而实现市场的再平衡。
 Bollinger Bands are a technical tool used by traders and investors to assess if a stock is overpriced or undervalued. The bands are essentially two lines that fluctuate with the price that are displayed on stock charts. They were created in the 1980s by financial expert John Bollinger. A simple moving average is calculated that represents the trend of interest, in our case a 100 day average. The upper and lower bands are placed above and below this moving average that represent a specific number of standard deviations. In our case we use two. Because the distance of the bands is based on standard deviation over 100 days, they expand and contract with price volatility. This means that in volatile markets resistance occurs at higher levels, while it’s lower in less volatile ones.
建议投资者在短期内对苹果股票保持警惕,同时密切关注市场动态和公司基本面,以便在市场调整期间捕捉到潜在的投资机会。长期来看,苹果公司的创新能力和市场地位依然稳固,但短期内的市场波动不容忽视。 $苹果(AAPL)$


精彩评论