What is the outlook for the US market like? Let us take a quick look at the charts of the key US indices for some insights.
DOW JONES
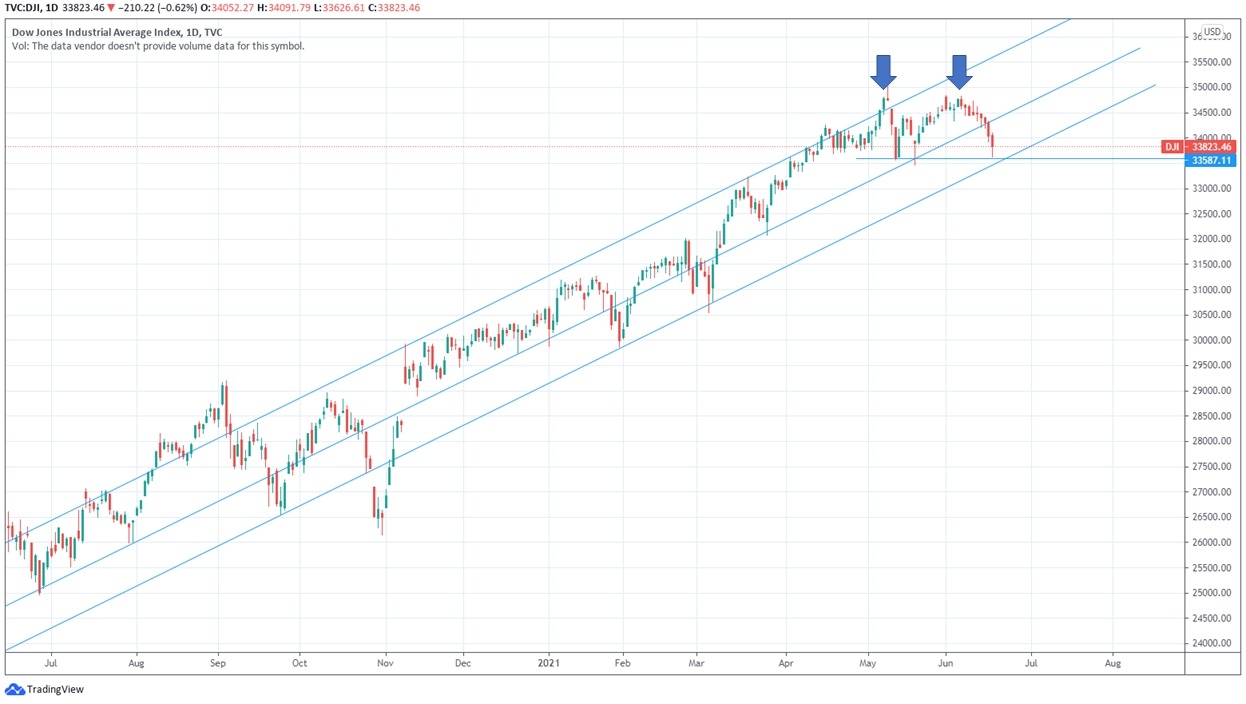
- There is a risk of a potential double top formation. After hitting resistance in early June, DJIA has reversed its course and is in a correction mode.
- DJIA still remains in the uptrend channel and the medium-term uptrend remains intact.
- Yesterdays price action was somewhat slightly bias towards the positive side. The index hit its horizontal support line and buyers came back to support, trimming the loses in the index.
- Outlook for DJIA: As the horizontal support line converges with the uptrend channel support line, there should be support at 33,600 level. This level may still be retested in the coming days and if hold up well, we can expect DJIA to start moving up and re-test the 34,800 resistance level.
- What could change the outlook: If a long red candlestick pierces below 33,600 support, it might be an indication of a halt in the uptrend, possibly moving into a consolidation phase.
NASDAQ
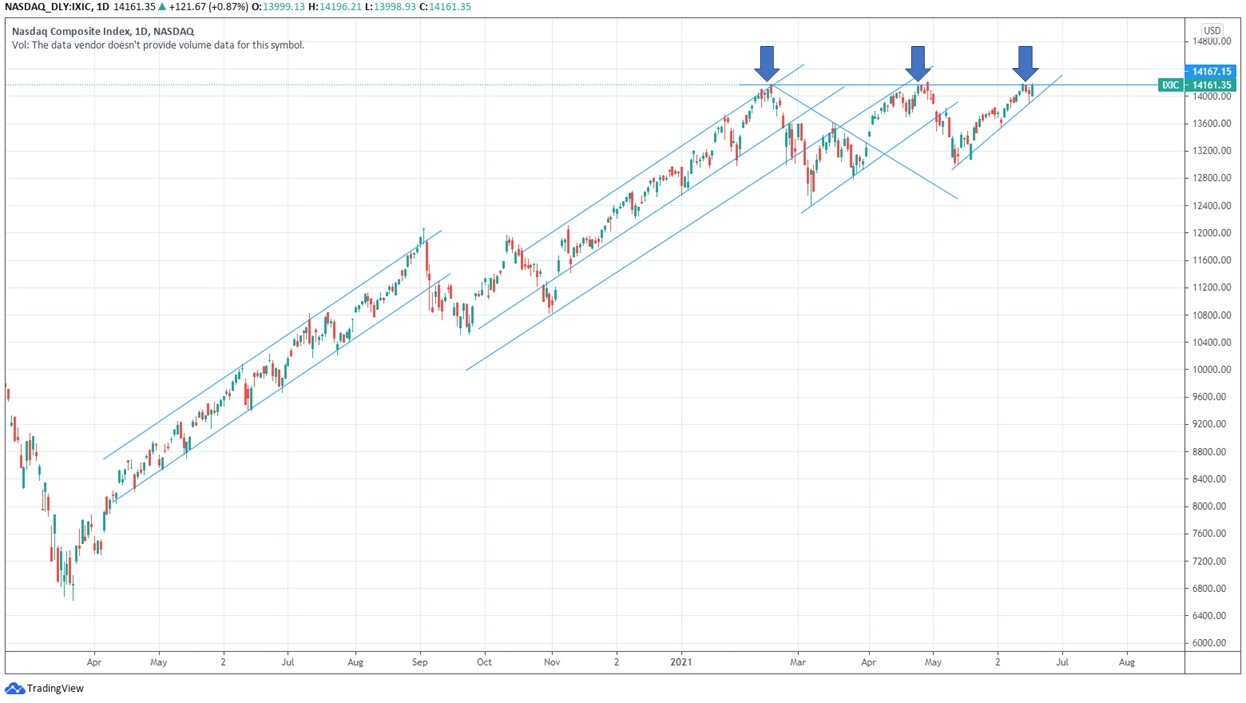
- Nasdaq is at a critical juncture as it is currently at resistance level formed by the 2 peaks that were achieved in Feb and Apr 2021.
- Yesterday's price-action was bullish as Nasdaq opened at the day's low and powered up through the day and closed near the day's high and forming a long green candlestick. The day earlier, Nasdaq also tested its trendline support and managed to recover. These are good bullish signs from the last 2 days of trading.
- Outlook for Nasdaq: Based on the last 2 days of trading, there is a good probability of Nasdaq breaking up above its 14,200 resistance to resume its uptrend and set new ATH. Moreover, with US 10-year bond yield in a downtrend, this will be supportive for Nasdaq.
- What could change the outlook: It would be a major concern if Nasdaq breaks below 13,950 as that would mean that the current uptrend line that started since mid-May would be broken. It will also indicate a very bearish triple top formation. Hence, these coming days and week will be critical.
S&P 500
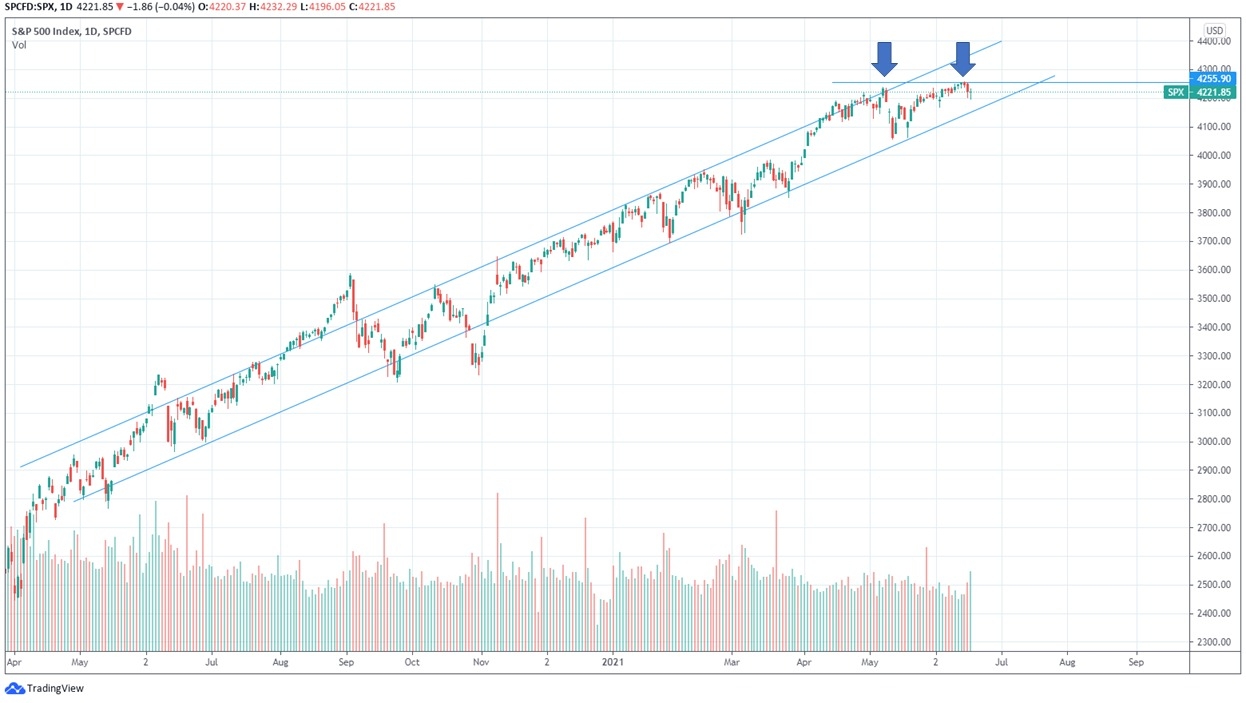
- S&P 500 is in a similar chart pattern as Dow Jones, but it looks more positive than Dow Jones as the index is still holding up near the ATH.
- Yesterday's price action was also positive. Similar as Dow Jones, it re-tested the low of 16 June and buyers came back to support, trimming the loses in the index.
- Outlook for S&P 500: It is likely that S&P 500 will retest its peak at around 4,260 again and continue its uptrend and set new ATH.
- What could change the outlook: Uptrend channel support is at 4,150 and this level needs to hold. There is still a safe margin of safety from current level hence risk is low.
US 10-Year Bond Yield
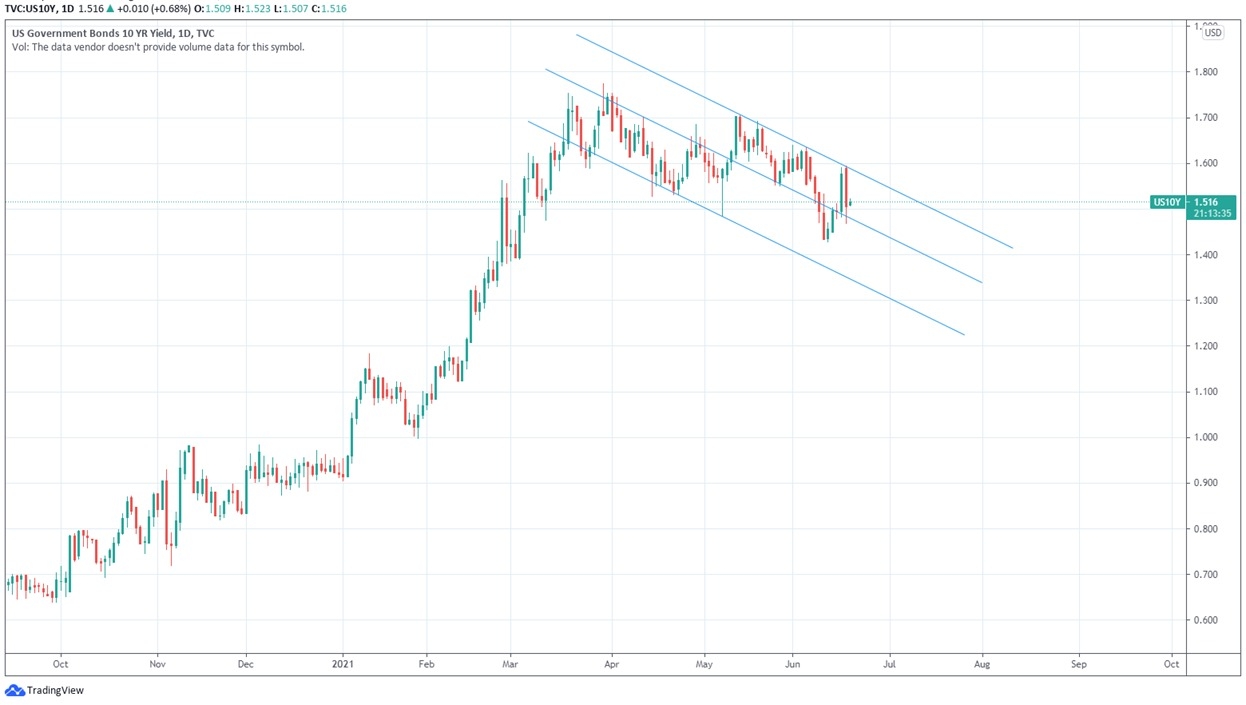
- After the FED FOMC meeting on Wednesday, the 10-yr bond yield jumped, hit the downtrend resistance line and yesterday, it dropped again and reversed most of its gain on Wednesday.
- Yesterday, long red candle can be viewed as a bearish engulfing candle, which may indicate that bond yield may continue in the downtrend channel over the near term.
- This will be supportive for the tech shares.
The above analysis is based on the existing chart and price action. Do take note that the market and sentiments can change rapidly. Traders need to be able to response quickly to any sudden change in market condition to protect capital or profit.
Trade with care and DYODD.


精彩评论