Virgin Galactic Holdings Inc. shares lost altitude Wednesday, continuing the downward spiral the stock has been on for months. The stock recently broke below a key level that it has been able to hold as support many times in the past.
Virgin Galactic was down 5.58% at $13.04 at the close.
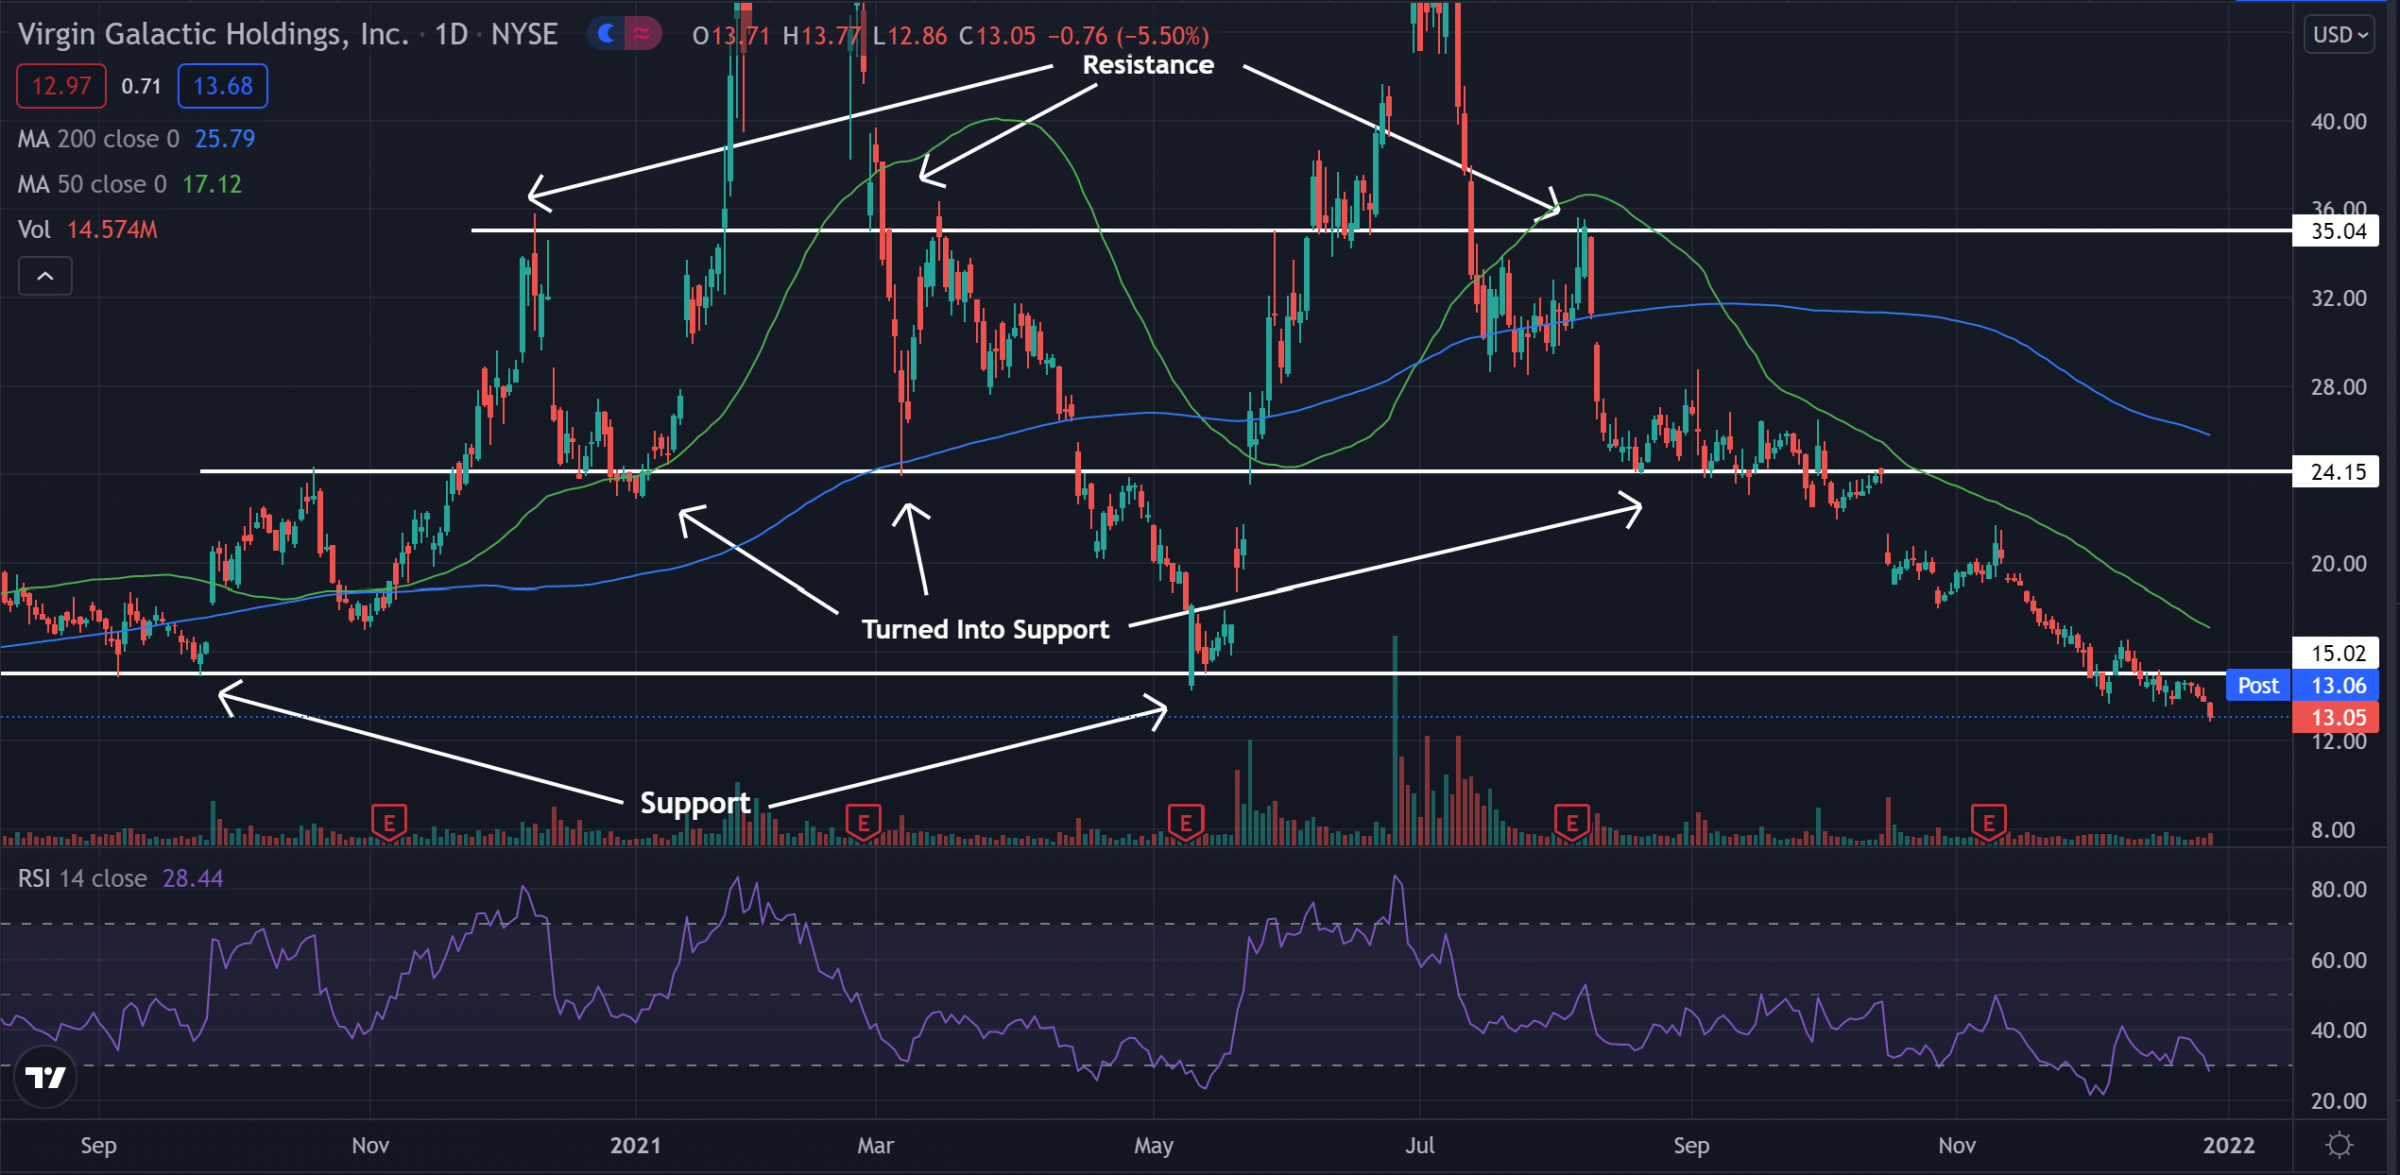
Virgin Galactic Daily Chart Analysis
- Shares fell below the key $15 level and have been falling since July 2021. The stock was unable to hold above the $24 level where it also found support in the past and has now fallen out of the sideways channel in which it traded.
- The stock trades below both the 50-day moving average (green) and the 200-day moving average (blue). This indicates the sentiment is bearish, and each of these moving averages may hold as an area of resistance in the future.
- The Relative Strength Index (RSI) has been moving sideways below the middle line and sits at 28 on the indicator. This shows that the stock is in the oversold range and the selling pressure is heavily outweighing the buying pressure.
What’s Next For Virgin Galactic?
Virgin Galactic has been on a downward spiral for the last half of the year and has fallen below all support lines. This shows bears are in full control of the stock and would like to see the stock continue to fall and hold below the moving averages.
Bulls on the other hand would like to see the stock make a bounce and be able to cross back above the $15 support line and be able to hold above it once again. Bulls are then looking for a cross back above the moving averages for sentiment to turn bullish once again.
精彩评论