Roblox Corp. shares are trading significantly lower Wednesday after the company announced its November metrics. Roblox said daily active users were 49.4 million, representing an increase of 35% year-over-year. Hours engaged totaled 3.6 billion, representing an increase of 32% year-over-year.
Roblox was down 9.03% closing at $97.95 on Wednesday.
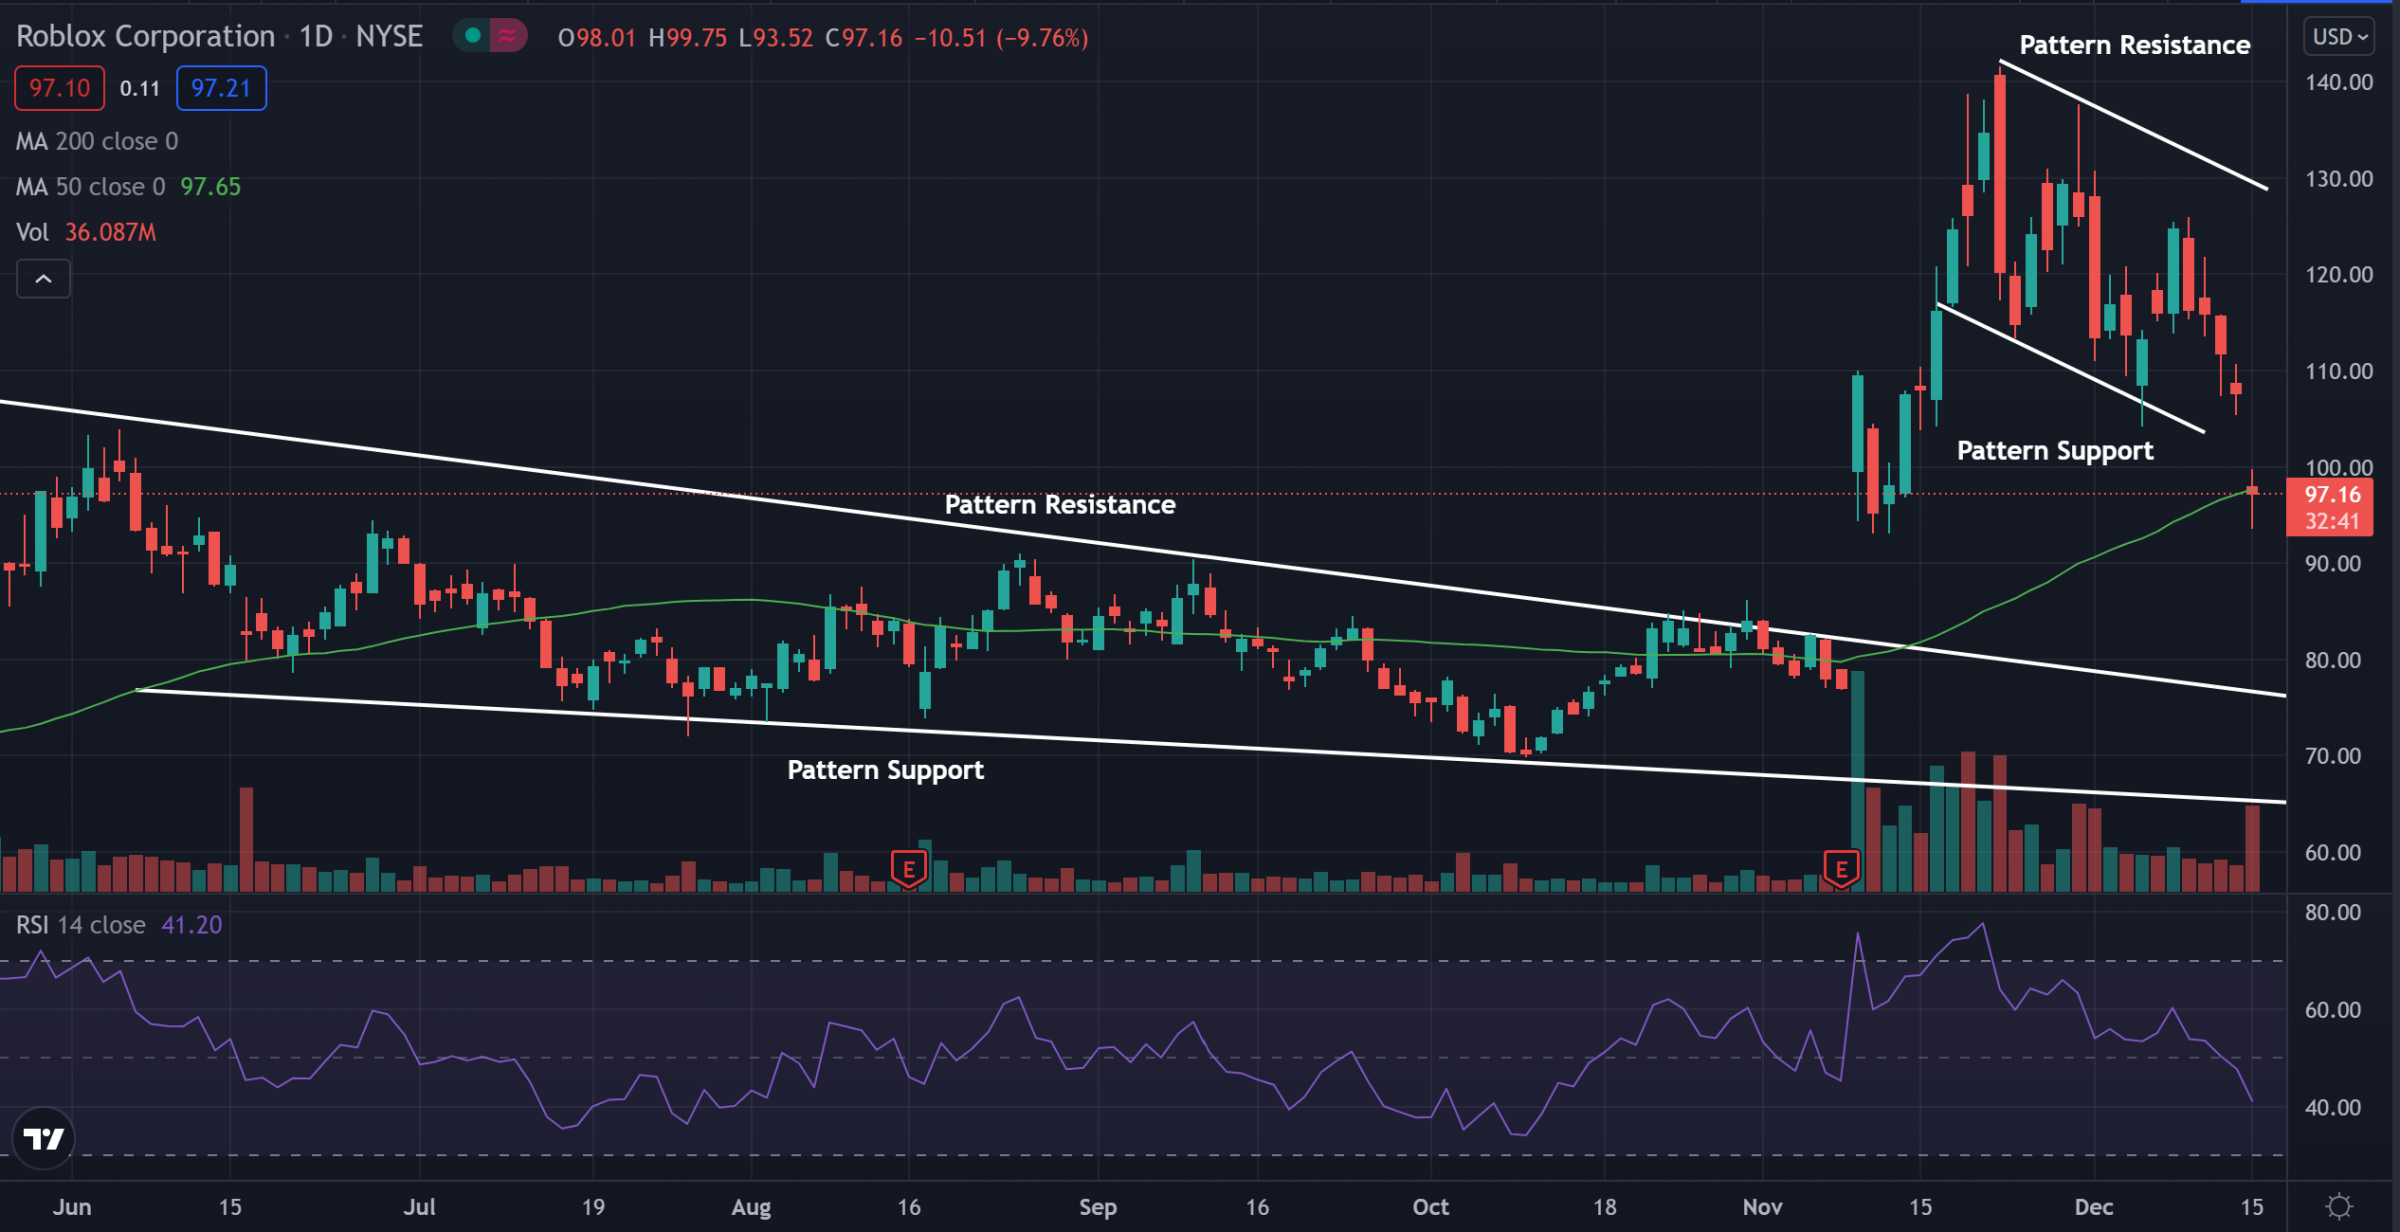
Roblox Daily Chart Analysis
- Roblox shares were trading in a bullish flag pattern but have fallen below pattern support and made a large bearish move. The stock is falling back toward the area where it traded in a falling wedge pattern.
- The stock crossed below the 50-day moving average (green) Wednesday, indicating the stock is likely facing a period of bearish sentiment. The 50-day moving average may hold as an area of resistance in the future for the stock.
- The Relative Strength Index (RSI) has been falling lower the past couple of weeks and now sits at 41. This shows that overall, the stock is seeing more sellers than buyers, which has caused the price to drop.
What’s Next For Roblox?
Roblox falling out of the bullish flag pattern shows that the stock was not ready to make another leg up. Following the drop, there may be a period of consolidation during which the stock will likely form new support and resistance levels and will hold between these levels until one is broken, and the stock makes another large move.
Bullish traders are looking to see the stock break above future resistance levels and head back toward where the stock traded within the flag pattern.
Bearish traders are looking to see the stock fall below future support levels and push toward where the stock traded in the wedge pattern.
精彩评论