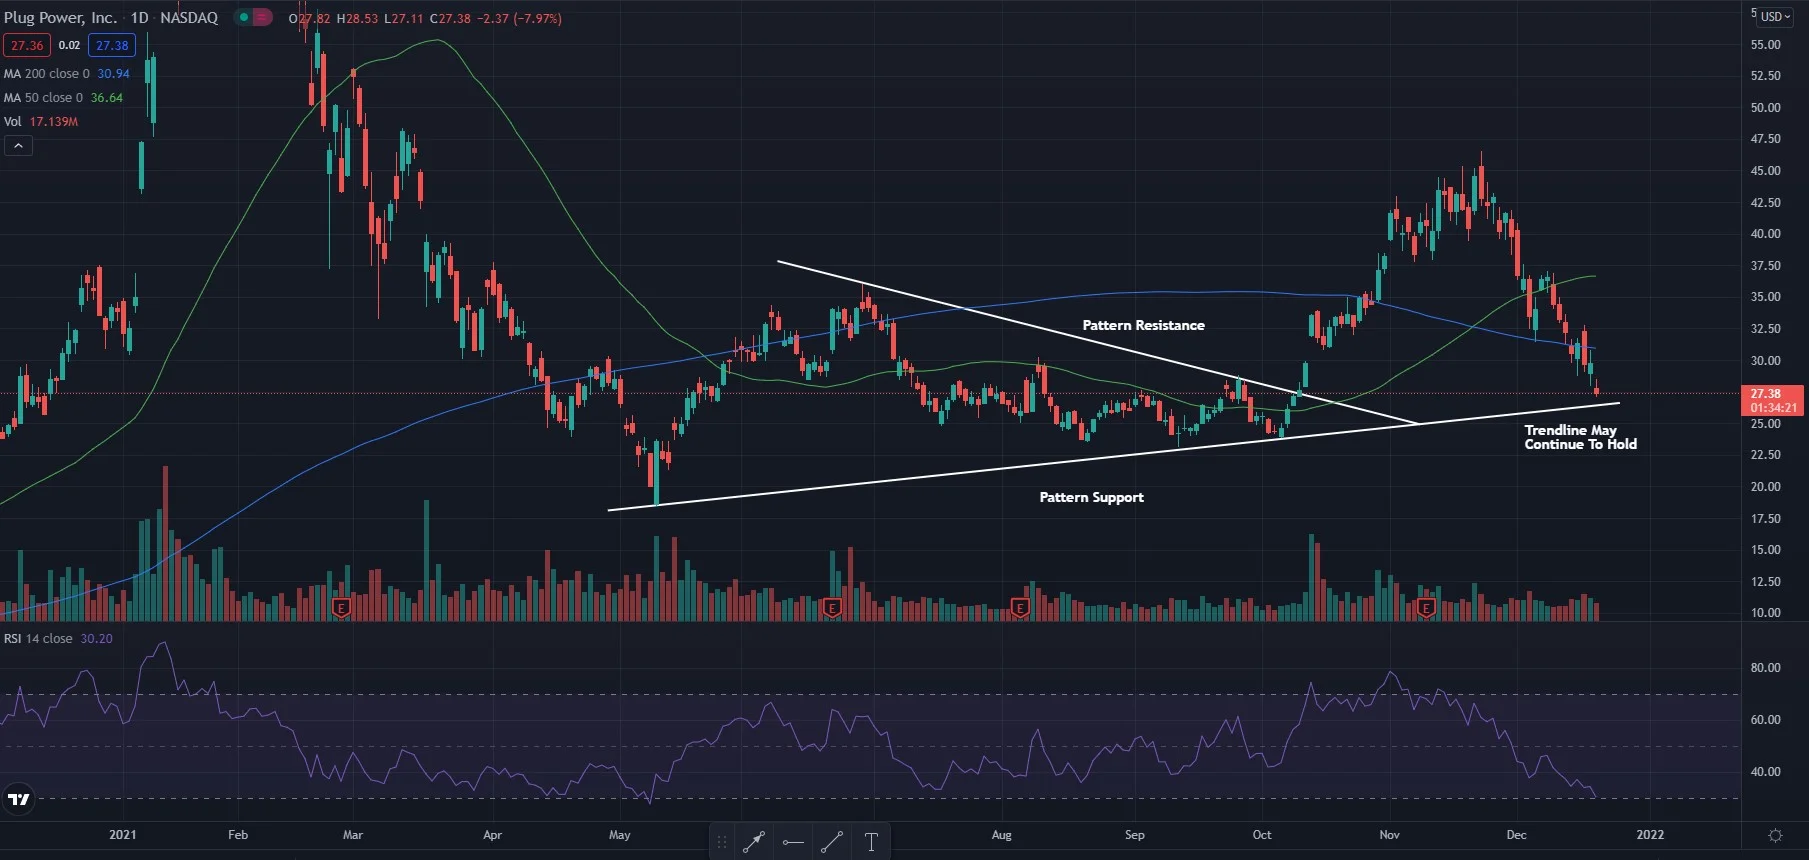
Plug Power Inc. shares were trading lower Monday and near an area that has been found as support in the past. The stock is in the bottom five of Robinhood Markets Inc Top 100 Most Popular Tickers watchlist.
Plug Power closed lower 8.13% at $27.33 on Monday.
Plug Power Daily Chart Analysis
- Shares broke out of a pennant pattern about two months ago and then saw a large run-up around the $45 area. Since then, shares have fallen back lower and are nearing the higher low trendline. This trendline could act as a place of support in the coming days.
- The stock trades below both the 50-day moving average (green) and the 200-day moving average (blue). This indicates bearish sentiment and each of these moving averages may hold as an area of resistance in the future.
- The Relative Strength Index (RSI) continues to push lower and now sits at 30. This dip lower shows the stock is on the border of the oversold area and is seeing many more sellers than buyers.
What’s Next For Plug Power?
Plug Power nearing the support line is a possible opportunity for bullish traders. If the stock can bounce off the higher low trendline it may continue to stay on the bullish trend it is on and start heading back higher. This is what bulls are looking for, in addition to the price crossing back above the moving averages again and changing sentiment to be more bullish. Bears on the other hand are looking for the stock to be unable to hold above this trendline and are hoping for a break below. A break below the trendline may cause a downward trend to start and for the stock to see a strong bearish push.

精彩评论