The sellers are about to hitTesla, Inc.(NASDAQ:TSLA).
The stock has staged an impressive rally over the past week as investors think it will benefit from the $2 trillion infrastructure bill, as well as a potential Green New Deal.
But the stock may have become overextended.
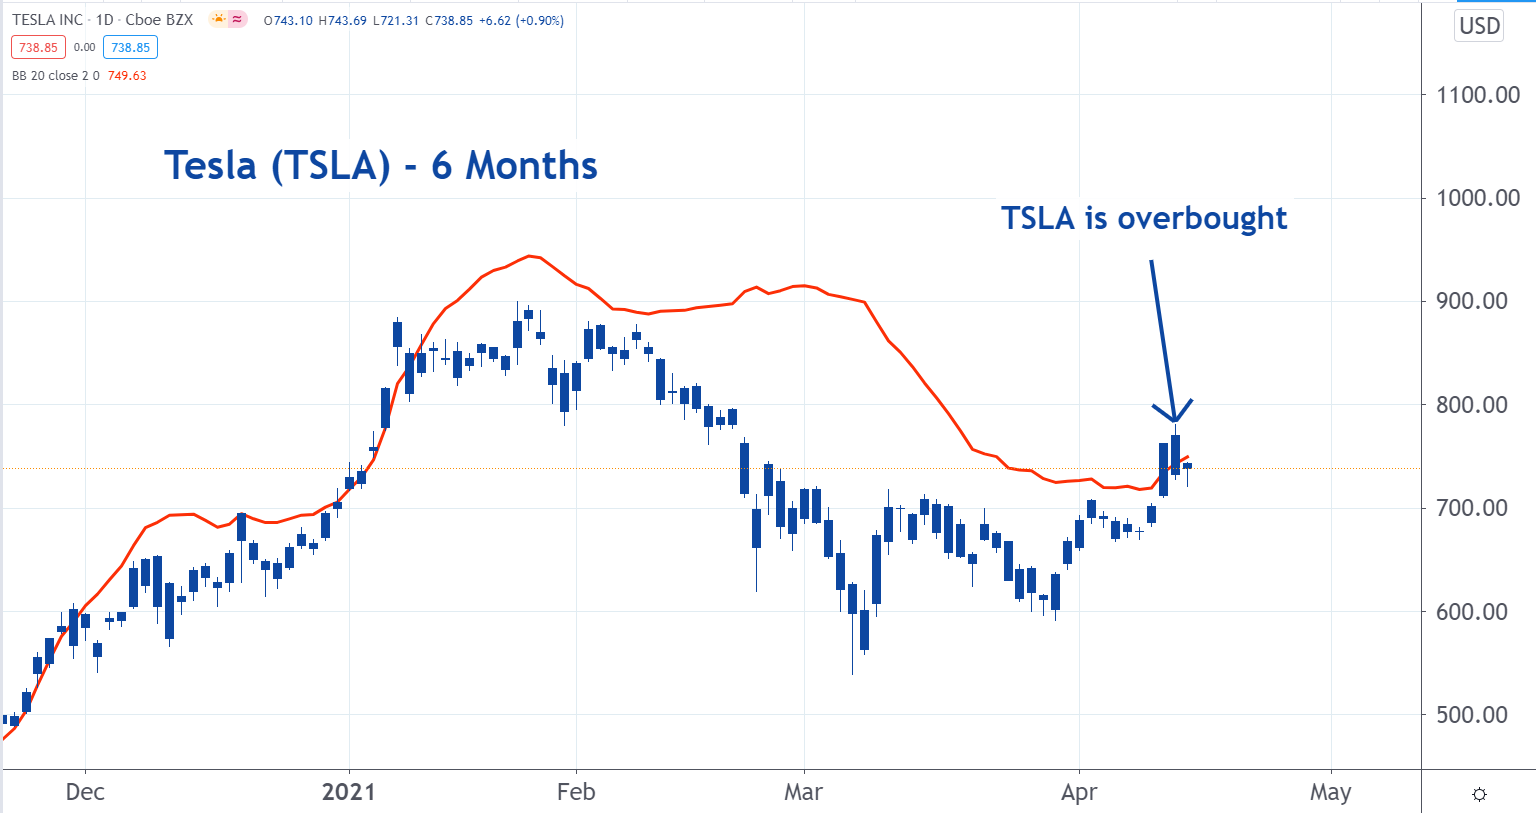
The red line on the following chart marks two standard deviations above its recent 20-day average price. Shares are trading above this threshold.
These overbought conditions will draw sellers into the market as they will expect a reversion to the average. This could put a top on the shares and it could even push them lower.

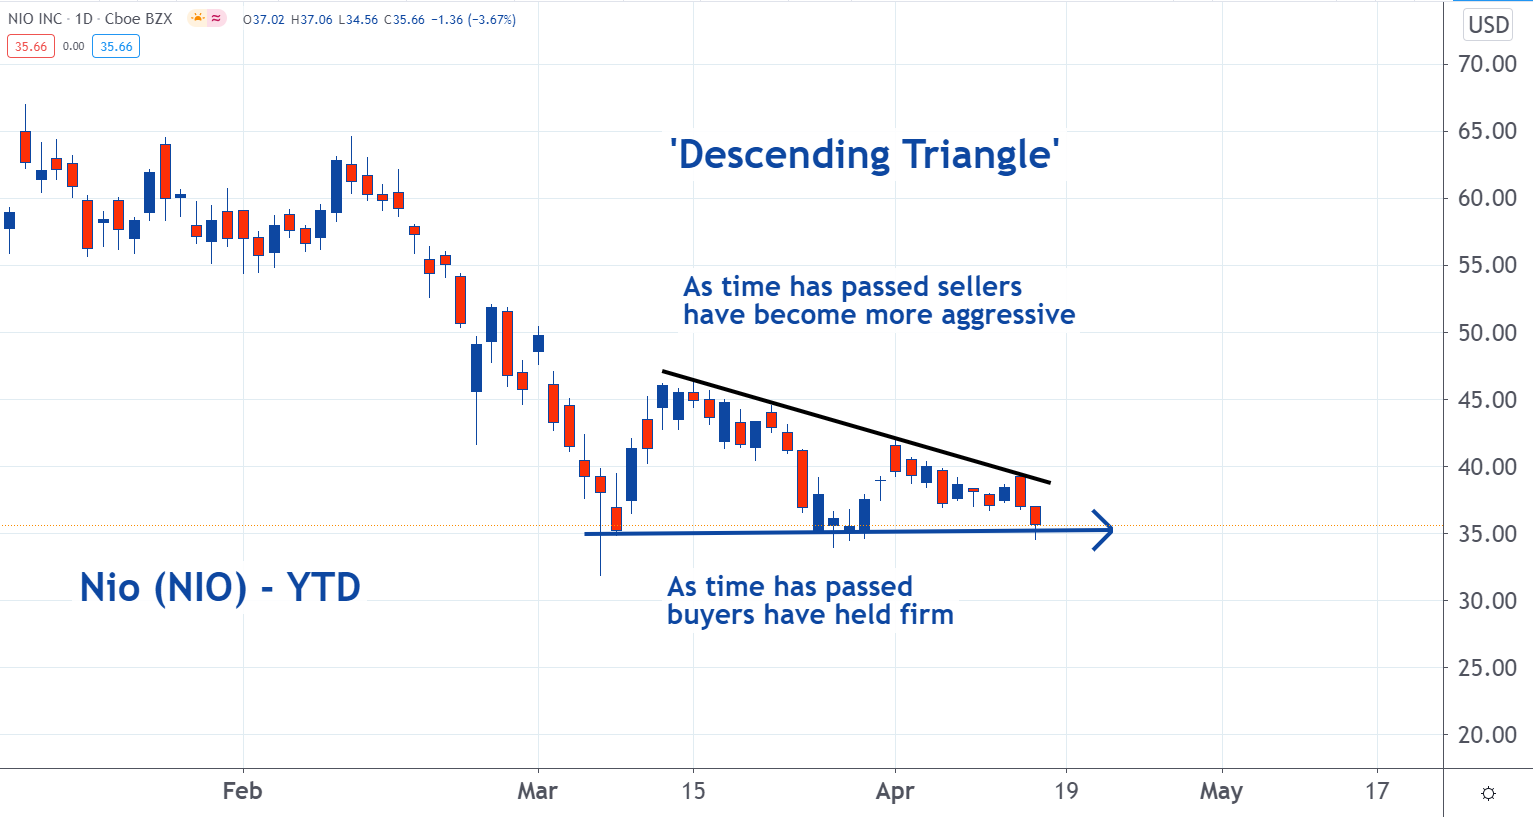
Chart patterns are illustrations of the supply and demand dynamics occurring within a market. This pattern shows buyers of NIO have been complacent. At the same time, sellers are becoming more aggressive.
Since early March buyers have held firm at the $35 level. At the same time, sellers have been knocking the shares lower.
In mid-March, the lowest price sellers would accept for their shares was around $45. By early April it had dropped to $40. Now there are sellers willing to accept $35.
The combination of aggressive sellers and complacent buyers could drive the price lower.

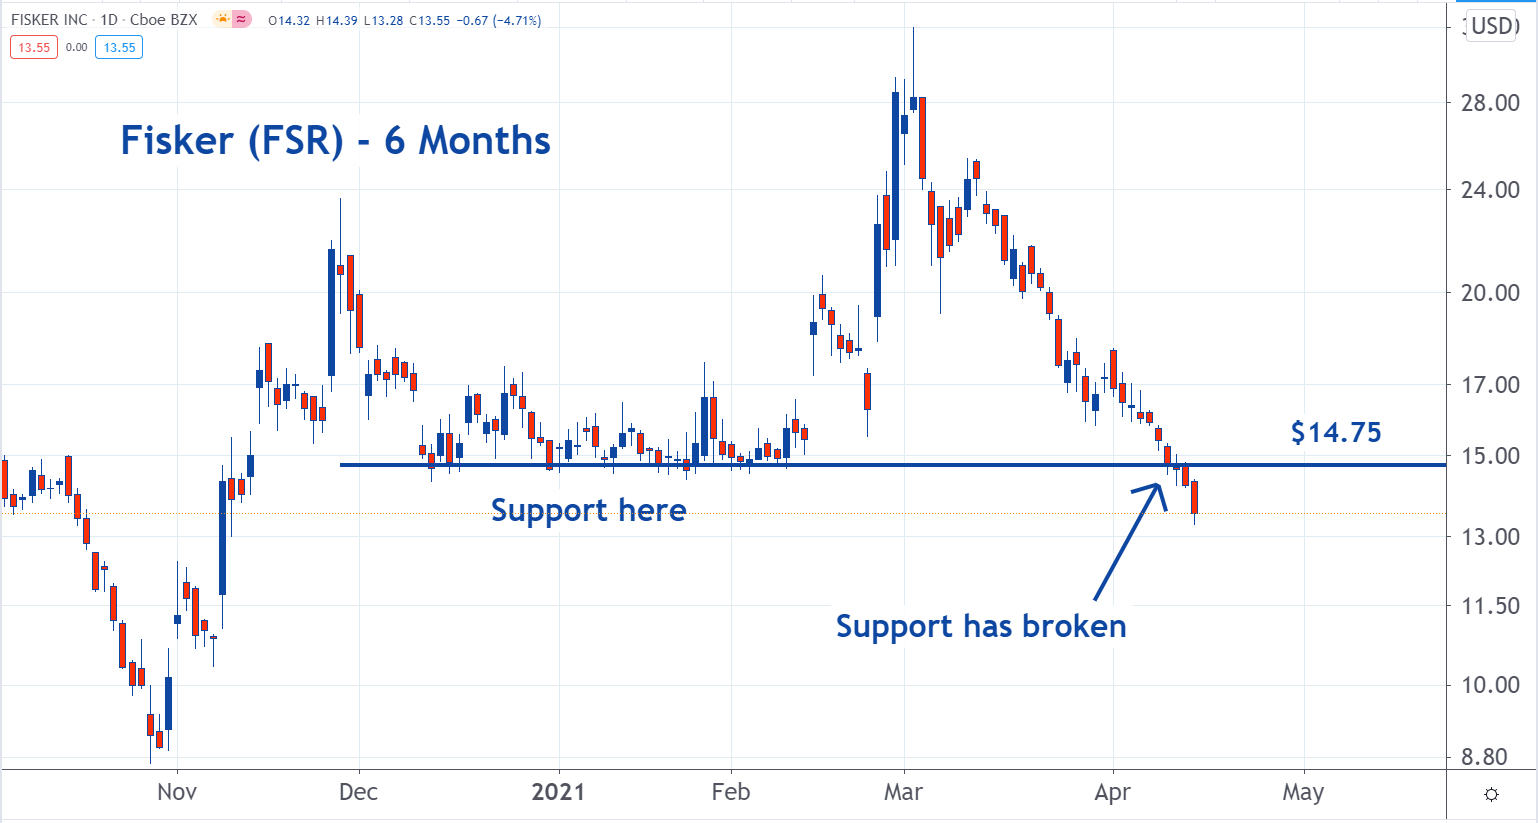
Support forms when there are a large number of buyers that are looking to pay the same price for shares of stock. In this case, it was the $14.75 level. It was clear support through December and January.
Now that level been has broken, which means the buyers who were willing to pay $14.75 have either finished or canceled their orders.
With this demand of the market, the stage is set for a further decline in the share price.

精彩评论