Netflix Inc. shares traded higher Tuesday on above-average volume. The stock looks to be recovering from the down day it had Monday and then some, forming into a textbook breakout from a pattern.
Netflix closed up 5.2% at $634.81 per share.
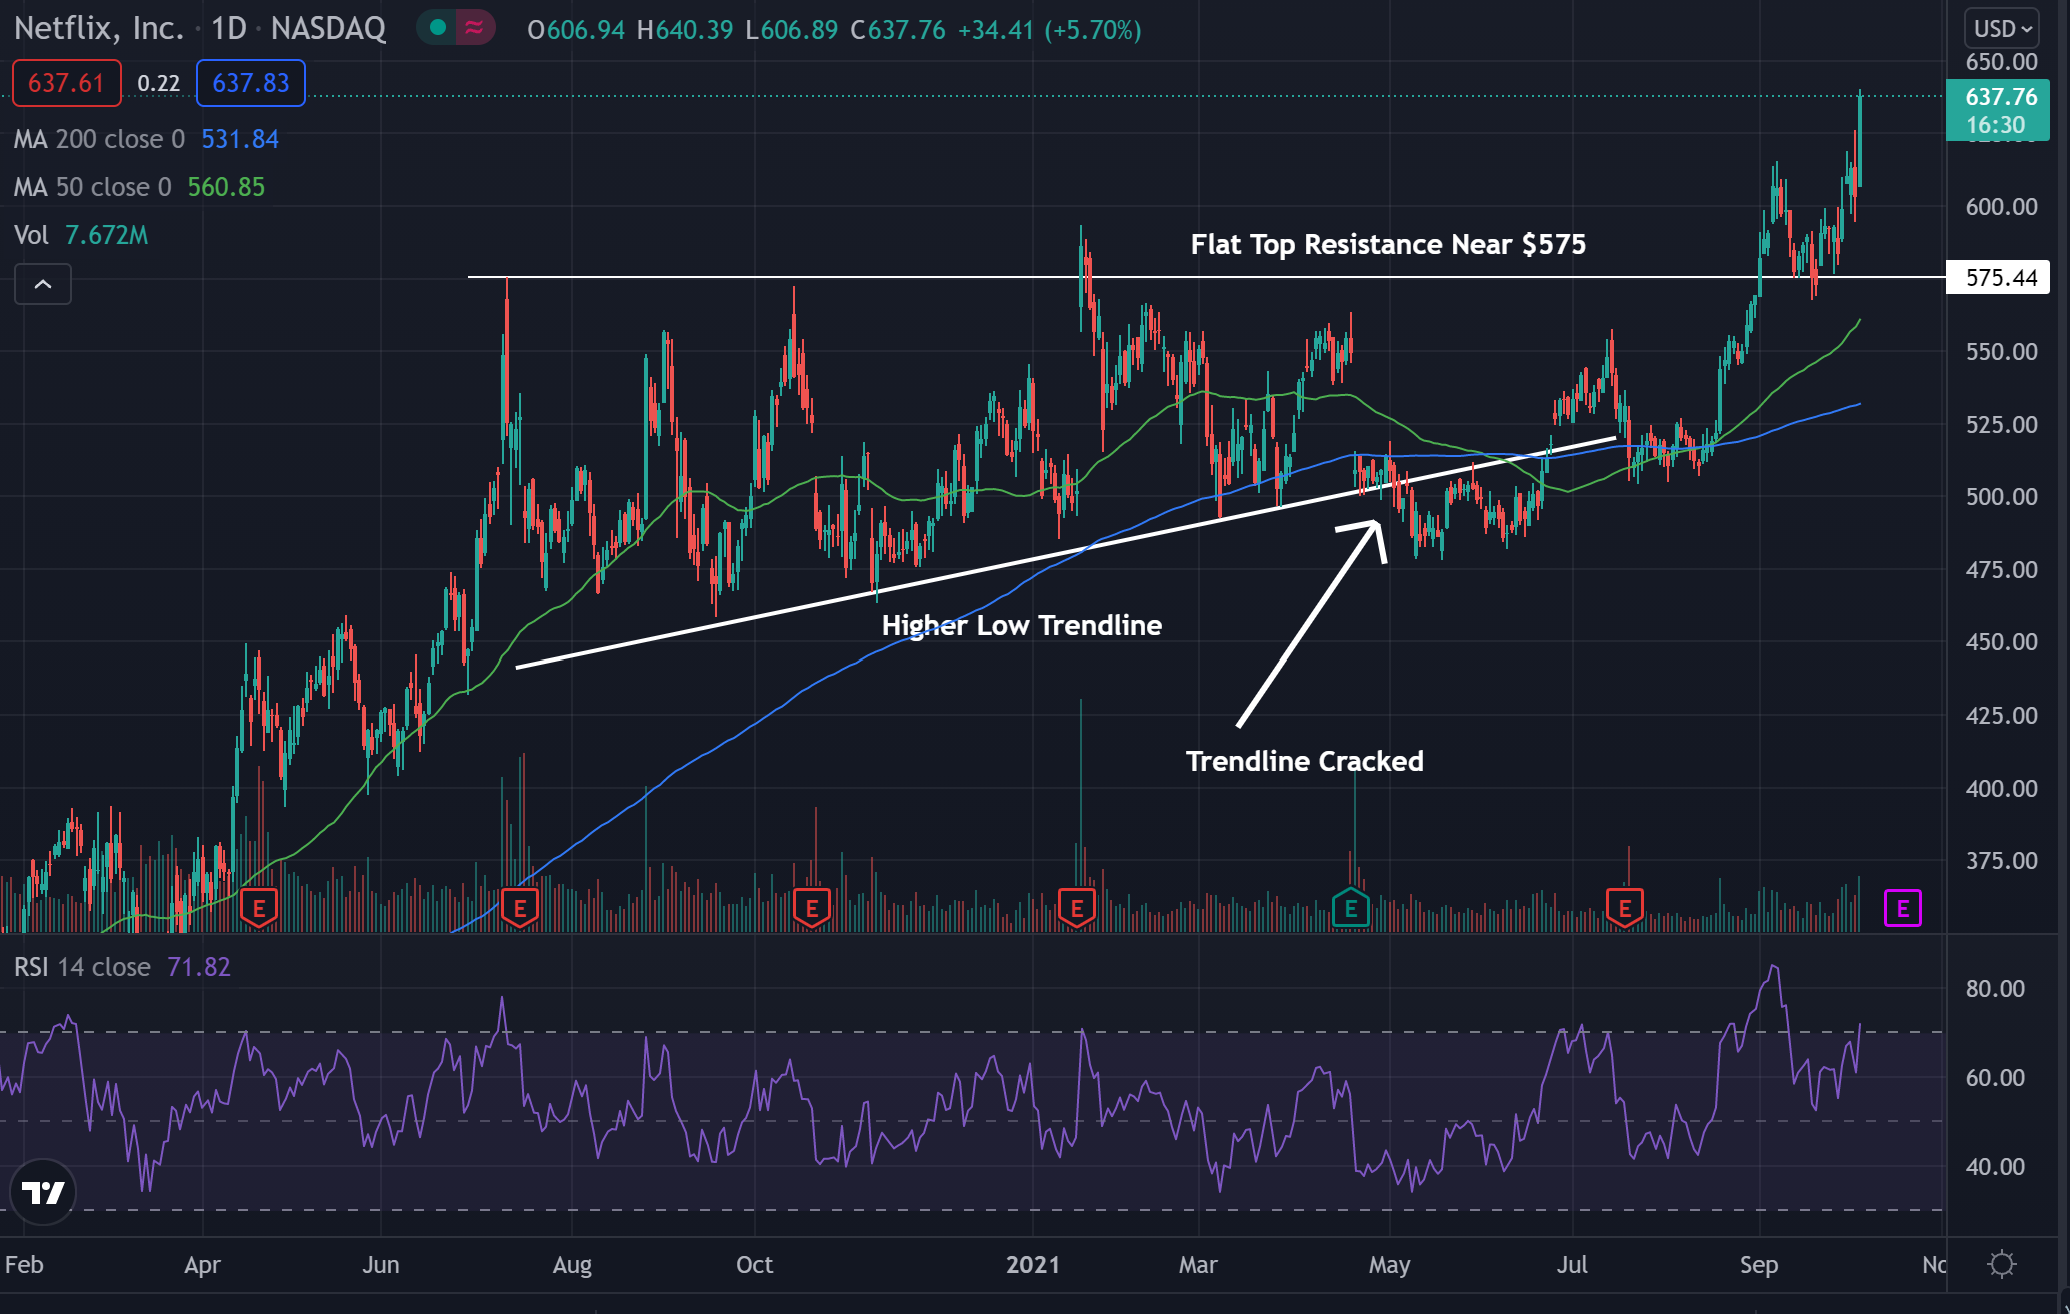
Netflix Daily Chart Analysis
- Shares were able to break out of resistance and then come back down and test the resistance level before starting on another leg up with a perfect bounce at support.
- The $575 level has held as resistance in the past but may continue to hold as support in the future. The higher low trendline is another area the stock could find support.
- The stock is trading above both the 50-day moving average (green) and the 200-day moving average (blue), indicating the sentiment in the stock has been bullish.
- Each of these moving averages may hold as a possible area of support in the future.
- The Relative Strength Index (RSI) has been climbing and sits at 72, which shows that buying pressure has been increasing. The RSI has now entered the overbought range, which shows the stock is seeing much more buying pressure than selling pressure.
What’s Next For Netflix?
Bullish traders want to see the stock continue to push higher. Eventually, the stock will cool off and bulls would like to see the stock form higher lows and maintain the long-term uptrend shown by the higher low trendline.
Bearish traders would like to see Netflix fall and cross below the higher low trendline. This could cause a change in trend and possibly the beginning of a downtrend.
精彩评论