The SPDR S&P 500 ETF (NYSE:SPY) opened down 1.23% Monday morning after declining 0.78% intraday on Friday. The sell-off is being attributed to the increased spread of the COVID-19 Delta variant and inflation fears but the dip could provide opportunities for bullish traders.
On Friday, options traders seemed to forecast a gap down on Monday morning and purchased over $9.12 million worth of bearish SPY put contracts. A number of traders purchased puts with a strike price of $430 with an expiry of July 21 which opened "in-the-money."
Big tech earnings kick off this week with Netflix Inc(NASDAQ:NFLX) reporting Tuesday afternoon and the dip could provide a strong buying opportunity if the streaming company beats expectations. The spread of the Delta variant could also cause the Federal Reserve to pause its talk of tapering, which would be a good sign for the bulls going forward into the third quarter and beyond.
For technical traders, regardless of the narrative around the recent pullback, the SPY has key levels to watch.
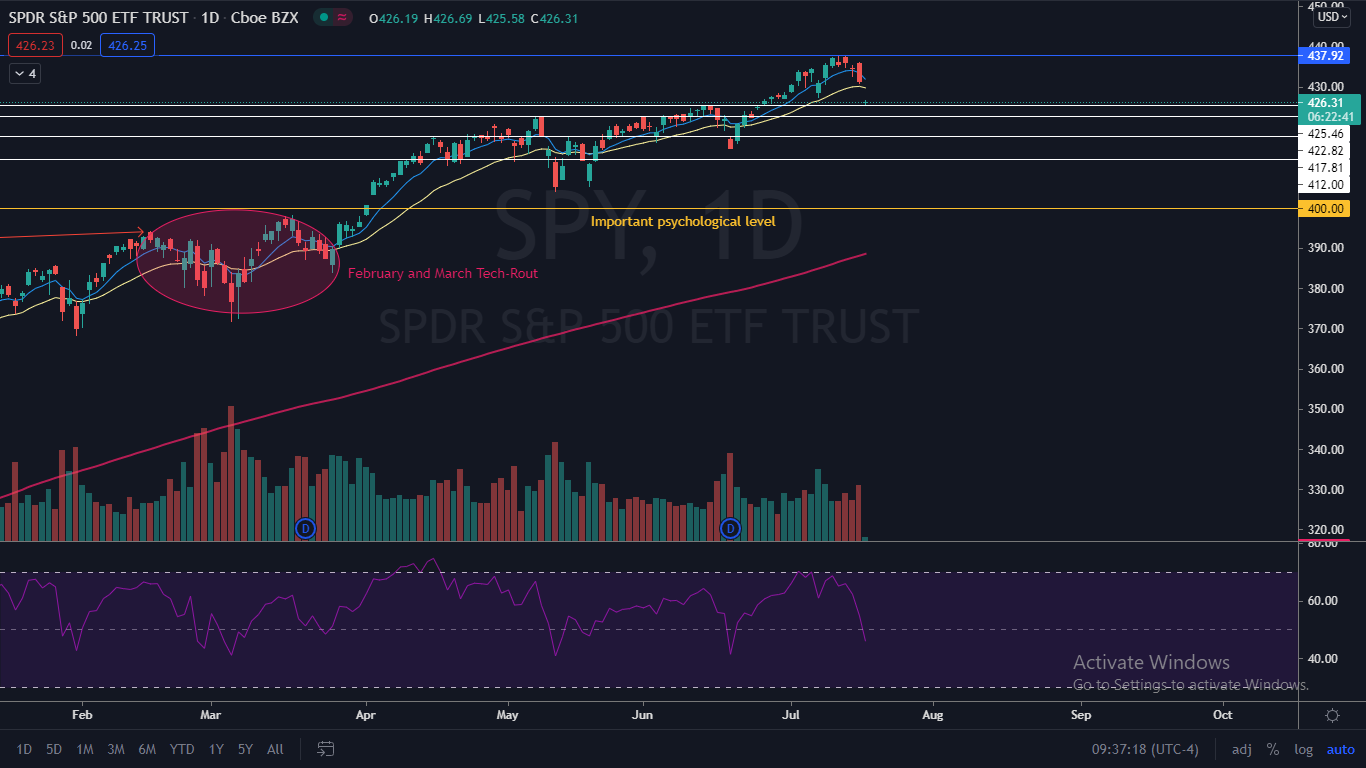
The SPY Chart: The SPY created a bearish double top pattern when it hit a new all-time high of $437.92 on Tuesday and Wednesday of last week. On Friday, the SPY printed a bearish engulfing candlestick pattern indicating lower prices were in the cards for Monday. An engulfing candlestick pattern is recognized by a candle that fully eclipses the previous smaller candlestick and has little or no upper or lower wick.
On Monday morning the SPY opened just above a key support zone at the $425 mark, tested the level as support and bounced. The SPY has another support level just below at $422.82 that may provide support if the SPY loses the $425 level.
The SPY is trading below both the eight-day and 21-day exponential moving averages (EMAs), which is bearish, but the eight-day EMA is trending above the 21-day EMA, which is bullish. This indicates indecision in the short term. The SPY is trading well above the 200-day simple moving average, which indicates overall sentiment remains bullish for the longer-term outlook.
SPY Price Action:The SPDR S&P 500 was trading down.
精彩评论