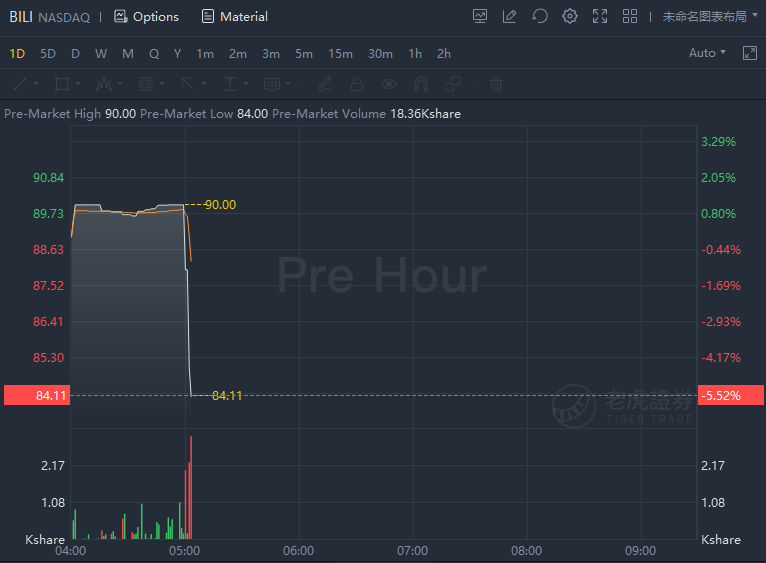
Bilibili slid over 5% in premarket trading as its net loss was RMB2,686.3 million.
Third Quarter 2021 Highlights:
- Total net revenuesreached RMB5,206.6 million (US$808.0 million), a 61% increase from the same period in 2020.
- Average monthly active users (MAUs)reached 267.2 million, and mobile MAUs reached 249.9 million, representing increases of 35% and 36%, respectively, from the same period in 2020.
- Average daily active users (DAUs)reached 72.1 million, a 35% increase from the same period in 2020.
- Average monthly paying users (MPUs1)reached 23.9 million, a 59% increase from the same period in 2020.
Third Quarter 2021 Financial Results
Total net revenues.Total net revenues were RMB5,206.6 million (US$808.0 million), representing an increase of 61% from the same period of 2020.
Mobile games.Revenues from mobile games were RMB1,391.7 million (US$216.0 million), representing an increase of 9% from the same period of 2020.
Value-added services (VAS).Revenues from VAS were RMB1,908.9 million (US$296.3 million), representing an increase of 95% from the same period of 2020, mainly attributable to the Company’s enhanced monetization efforts, led by an increased number of paying users for the Company’s value-added services including the premium membership program, live broadcasting services and other value-added services.
Advertising.Revenues from advertising were RMB1,172.0 million (US$181.9 million), representing an increase of 110% from the same period of 2020. This increase was primarily attributable to further recognition of Bilibili’s brand name in China’s online advertising market, as well as Bilibili’s improved advertising efficiency.
E-commerce and others.Revenues from e-commerce and others were RMB734.0 million (US$113.9 million), representing an increase of 78% from the same period of 2020, primarily attributable to the increase in sales of products through the Company’s e-commerce platform.
Cost of revenues.Cost of revenues was RMB4,188.1 million (US$650.0 million), representing an increase of 70%, compared with the same period of 2020. Revenue-sharing cost, a key component of cost of revenues, was RMB2,157.5 million (US$334.8 million), representing an increase of 83% from the same period in 2020.
Gross profit.Gross profit was RMB1,018.5 million (US$158.1 million), representing an increase of 34% from the same period in 2020, which was primarily due to increased net revenues.
Total operating expenses.Total operating expenses were RMB2,896.5 million (US$449.5 million), representing an increase of 57% from the same period of 2020.
Sales and marketing expenses.Sales and marketing expenses were RMB1,633.3 million (US$253.5 million), representing a 37% increase year-over-year. The increase was primarily attributable to increased channel and marketing expenses to promote Bilibili’s app and brand, as well as promotional expenses for the Company’s mobile games and an increase in headcount in sales and marketing personnel.
General and administrative expenses.General and administrative expenses were RMB474.9 million (US$73.7 million), representing an 87% increase year-over-year. The increase was primarily due to increased headcount in general and administrative personnel, increased share-based compensation expenses, higher rental expenses and other general and administrative expenses.
Research and development expenses.Research and development expenses were RMB788.3 million (US$122.3 million), representing a 97% increase year-over-year. The increase was primarily due to increased headcount in research and development personnel and increased share-based compensation expenses.
Loss from operations.Loss from operations was RMB1,878.0 million (US$291.5 million), compared with RMB1,083.3 million in the same period of 2020.
Investment income/(loss), net.Net investment income/(loss) primarily included return earned on financial products issued by banks and other financial institutions, return from investments in money market funds, and the fair value change of investments in publicly traded companies. Net investment loss was RMB724.3 million (US$112.4 million), compared with net investment income of RMB14.2 million in the same period of 2020. The change was mainly attributable to the fair value change of investments in publicly traded companies.
Income tax expense.Income tax expense was RMB28.3 million (US$4.4 million), compared with RMB17.3 million in the same period of 2020.
Net loss.Net loss was RMB2,686.3 million (US$416.9 million), compared with RMB1,100.9 million in the same period of 2020.
Adjusted net loss2.Adjusted net loss, which is a non-GAAP measure that excludes share-based compensation expenses, amortization expense related to intangible assets acquired through business acquisitions, income tax related to intangible assets acquired through business acquisitions and loss/(gain) on fair value change in investments in publicly traded companies, was RMB1,622.0 million (US$251.7 million), compared to RMB967.1 million in the same period of 2020.
Basic and diluted EPS and adjustedbasic and diluted EPS2. Basic and diluted net loss per share were RMB6.90 (US$1.07), compared with RMB3.08 in the same period of 2020. Adjusted basic and diluted net loss per share were RMB4.16 (US$0.65), compared with RMB2.70 in the same period of 2020.
Cash and cash equivalents, time deposits and short-term investments.As of September 30, 2021, the Company had cash and cash equivalents, time deposits, and short-term investments of RMB24.4 billion (US$3.8 billion), compared with RMB12.8 billion as of December 31, 2020.
Outlook
For the fourth quarter of 2021, the Company currently expects net revenues to be between RMB5.7 billion and RMB5.8 billion.

精彩评论