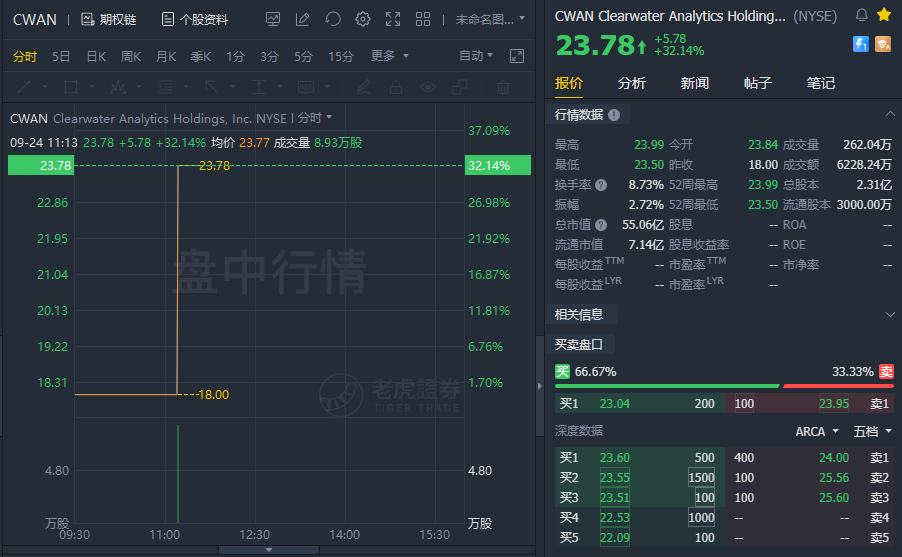
(Sept 24) Clearwater Analytics Holdings, Inc. opens for trading at $23.8, up about 32% from IPO price.
Company & Technology
Boise, Idaho-based Clearwater was founded to develop a SaaS platform to simplify investment accounting and analysis for asset managers, insurance companies and large corporations.
Management is headed by Chief Executive Officer Sandeep Sahai, who has been with the firm since September 2016 and was previously CEO of Solmark, an investment partnership.
The company’s primary offerings include:
Investment accounting and reporting
Performance measurement
Compliance monitoring
Risk analysis
Clearwater has received at least $421 million in notes payable in equity investment from investors including Welsh Carson, Permira, Warburg Pincus and Dragoneer.
Customer Acquisition
The firm pursues client relationships with asset managers, insurance companies and large corporations via a direct sales and marketing force that is focused on the United States.
CWAN also has international clients and will seek to expand its international presence post-IPO.
Clearwater handles data on over $5.6 trillion in assets between more than 1,000 clients.
Sales and Marketing expenses as a percentage of total revenue have varied as revenues have increased, as the figures below indicate:
Sales and Marketing |
Expenses vs. Revenue |
Period |
Percentage |
Six Mos. Ended June 30, 2021 |
13.6% |
2020 |
10.9% |
2019 |
11.4% |
The Sales and Marketing efficiency rate, defined as how many dollars of additional new revenue are generated by each dollar of Sales and Marketing spend, dropped to 1.4x in the most recent reporting period, as shown in the table below:
Sales and Marketing |
Efficiency Rate |
Period |
Multiple |
Six Mos. Ended June 30, 2021 |
1.4 |
2020 |
1.6 |
The Rule of 40 is a software industry rule of thumb that says that as long as the combined revenue growth rate and EBITDA percentage rate equal or exceed 40%, the firm is on an acceptable growth/EBITDA trajectory.
CWAN’s most recent calculation was 41% during the six months ended June 30, 2021, so the firm has performed well in this regard, per the table below:
Rule of 40 |
Calculation |
Recent Rev. Growth % |
24% |
EBITDA % |
17% |
Total |
41% |
The firm’s dollar-based net revenue retention rate for June 30, 2021 was 109%, a reasonably good result.
The dollar-based net revenue retention rate metric measures how much additional revenue is generated over time from each cohort of customers, so that a figure over 100% means that the company is generating more revenue from the same customer cohort over time, indicating good product/market fit and efficient sales and marketing efforts.
Market & Competition
According to a 2021 marketresearch reportby Market Primes, the global investment management software market was an estimated $3 billion in 2019 and is forecast to reach nearly $4.5 billion by 2025.
This represents a forecast CAGR of 10.2% from 2019 to 2025.
The main drivers for this expected growth are a desire by users to automate repetitive tasks so they can focus on maximizing portfolio performance and creating more sophisticated approaches.
Also, assessing risks and exposures and being able to efficiently report and share the information with stakeholders will drive demand for more capable solutions.
Major competitive or other industry participants include:
SS&C
State Street
SAP
BNY Mellon (Eagle)
Simcorp
BlackRock
FIS
Northern Trust
Others
Financial Performance
Clearwater’s recent financial results can be summarized as follows:
Strong topline revenue growth
Increasing gross profit and gross margin
A swing to operating profit and net profit
Uneven cash used in operations
Below are relevant financial results derived from the firm’s registration statement:
Total Revenue |
||
Period |
Total Revenue |
% Variance vs. Prior |
Six Mos. Ended June 30, 2021 |
$ 117,770,000 |
23.8% |
2020 |
$ 203,222,000 |
21.0% |
2019 |
$ 168,001,000 |
|
Gross Profit (Loss) |
||
Period |
Gross Profit (Loss) |
% Variance vs. Prior |
Six Mos. Ended June 30, 2021 |
$ 87,872,000 |
28.8% |
2020 |
$ 149,959,000 |
24.1% |
2019 |
$ 120,856,000 |
|
Gross Margin |
||
Period |
Gross Margin |
|
Six Mos. Ended June 30, 2021 |
74.61% |
|
2020 |
73.79% |
|
2019 |
71.94% |
|
Operating Profit (Loss) |
||
Period |
Operating Profit (Loss) |
Operating Margin |
Six Mos. Ended June 30, 2021 |
$ 20,544,000 |
17.4% |
2020 |
$ (20,418,000) |
-10.0% |
2019 |
$ 25,697,000 |
15.3% |
Net Income (Loss) |
||
Period |
Net Income (Loss) |
|
Six Mos. Ended June 30, 2021 |
$ 3,200,000 |
|
2020 |
$ (44,230,000) |
|
2019 |
$ 7,732,000 |
|
Cash Flow From Operations |
||
Period |
Cash Flow From Operations |
|
Six Mos. Ended June 30, 2021 |
$ (16,352,000) |
|
2020 |
$ (6,486,000) |
|
2019 |
$ (230,029,000) |
As of June 30, 2021, Clearwater had $41 million in cash and $450 million in total liabilities.
Free cash flow during the twelve months ended June 30, 2021, was negative ($38 million).
Valuation Metrics
Below is a table of the firm’s relevant capitalization and valuation metrics at IPO, excluding the effects of underwriter options:
Measure [TTM] |
Amount |
Market Capitalization at IPO |
$3,472,178,130 |
Enterprise Value |
$3,470,109,130 |
Price / Sales |
15.37 |
EV / Revenue |
15.36 |
EV / EBITDA |
-141.93 |
Earnings Per Share |
-$0.23 |
Float To Outstanding Shares Ratio |
12.96% |
Proposed IPO Midpoint Price per Share |
$15.00 |
Net Free Cash Flow |
-$38,024,000 |
Free Cash Flow Yield Per Share |
-1.10% |
Revenue Growth Rate |
23.83% |
Commentary
CWAN intends to go public to pay down debt and will have a net of $55 million in debt post-IPO.
The firm’s financials show strong topline revenue growth and gross profit growth and a rebound to operating profit and net income after negative results in 2020.
Free cash flow for the twelve months ended June 30, 2021, was a decidedly unimpressive negative ($38 million).
Sales and Marketing expenses as a percentage of total revenue have varied as revenue has increased; its Sales and Marketing efficiency rate dropped slightly to 1.4x in the most recent six-month period.
CWAN's dollar-based net retention rate was 109% for June 30, 2021, a positive result and its Rule of 40 performance was good as well.
The market opportunity for selling investment management software is large and expected to grow substantially in the years ahead, but the firm has extensive competition.
Goldman Sachs is the lead left underwriter and IPOs led by the firm over the last 12-month period have generated an average return of 40.5% since their IPO. This is a middle-tier performance for all major underwriters during the period.
The primary risk to the company’s outlook is the degree of competition and specialization present in various submarkets in which it competes, as well as the ability for some larger prospects to develop solutions in-house.
As for valuation, compared to competitor Simcorp, the CWAN IPO is much more highly priced on a revenue multiple basis. In my view, this is justified as the firm is growing revenue at a significantly higher rate of growth.
After a difficult period during 2020 where the firm produced operating losses, 2021 has seen a return to operating and net profits with impressive growth as well.
Given CWAN’s growth trajectory and the investment management software industry’s strong growth potential in the years ahead, the IPO is worth a close look.
精彩评论