Investors experienced another great year for stocks in 2021, with the SPDR S&P 500 ETF Trust on track to finish the year with a roughly 30% total return.
LPL Financial Chief Market Strategist Ryan Detrickrecently recappedLPL’s top 27 charts and tables of 2021, reflecting the trends he was watching in a strong year for stocks.
Here are eight of the best LPL charts of the year.
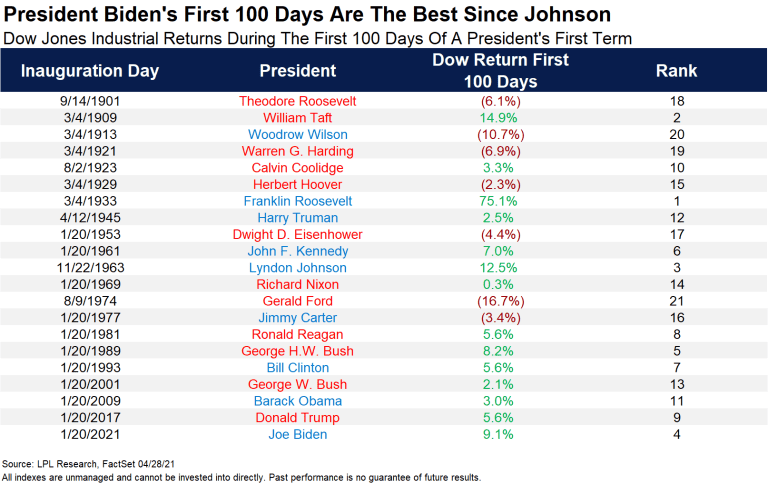
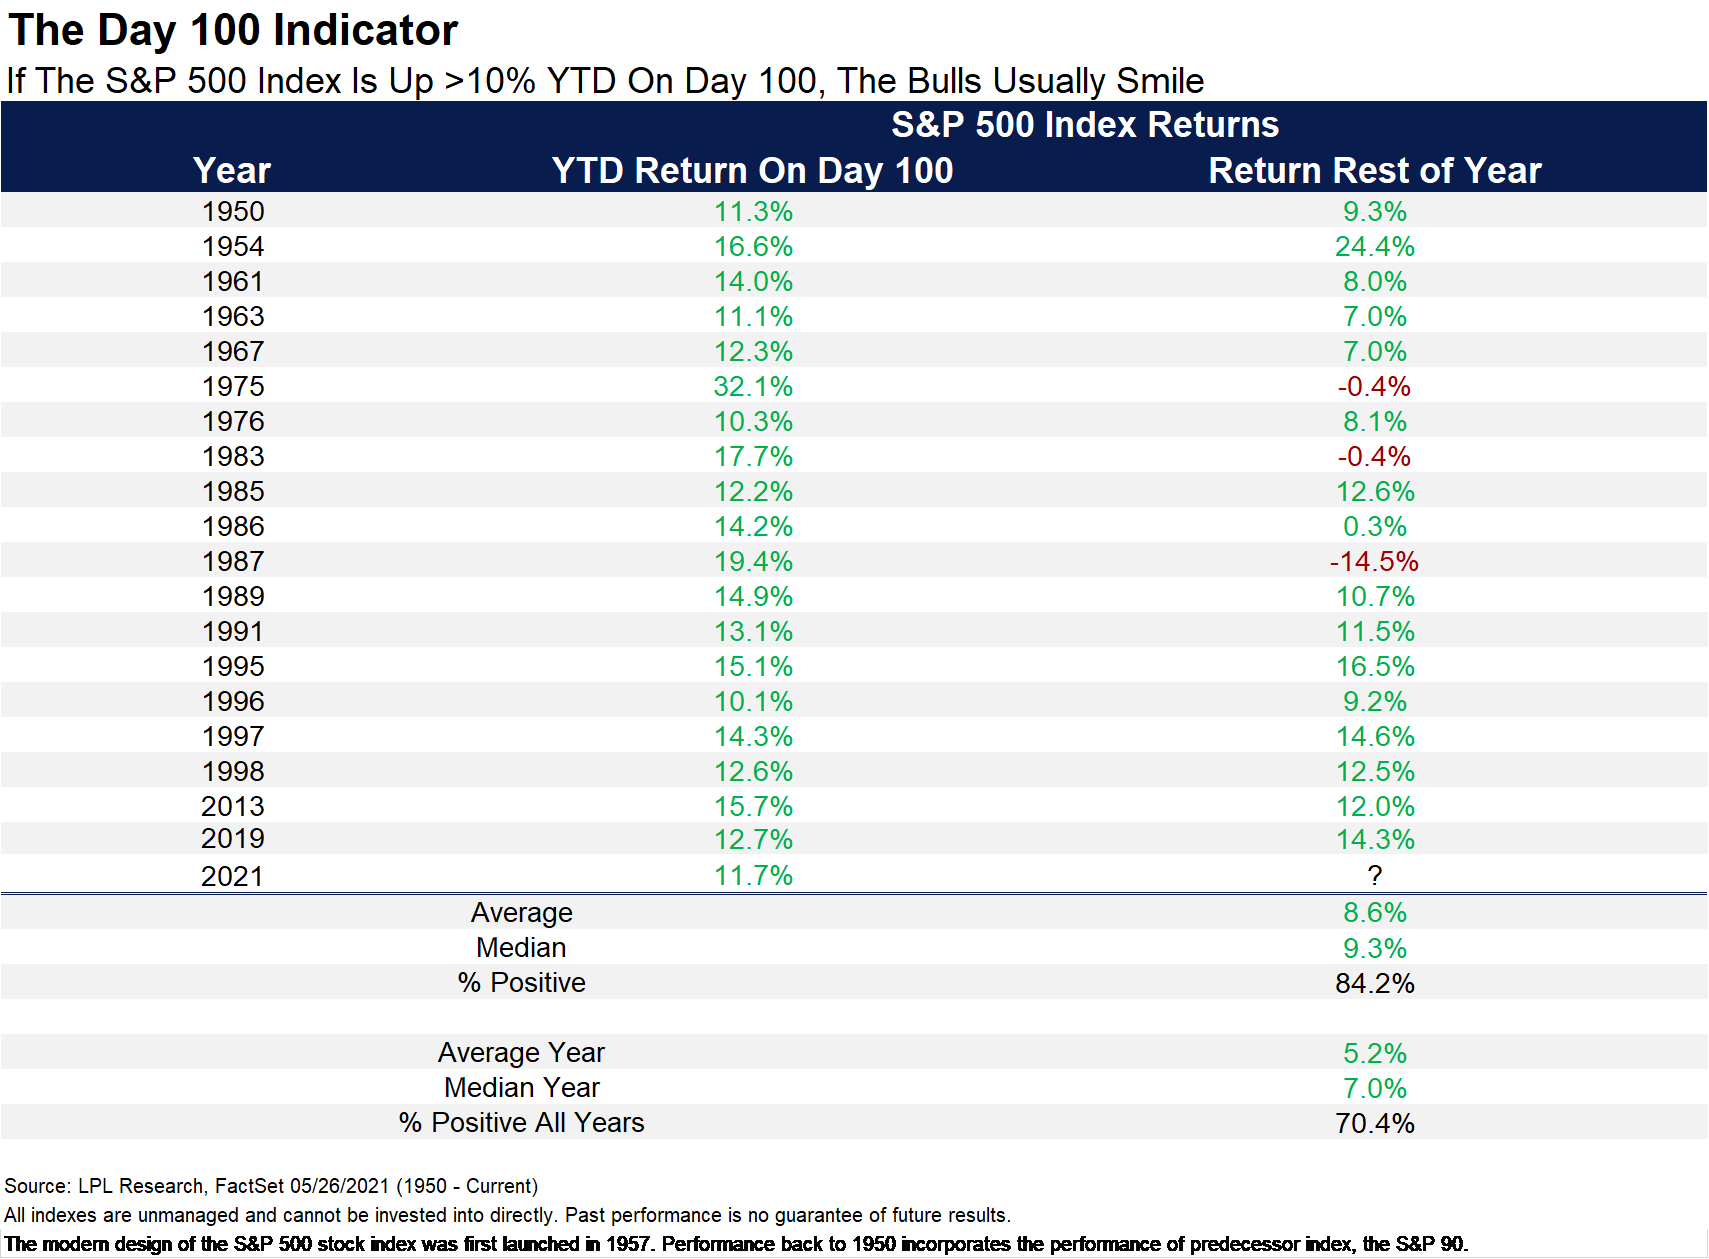
Stocks got off to a strong start to 2021. In fact, the S&P 500’s performance in the first 100 days of President Joe Biden’s administration was the best of any president since Lyndon Johnson in 1963.
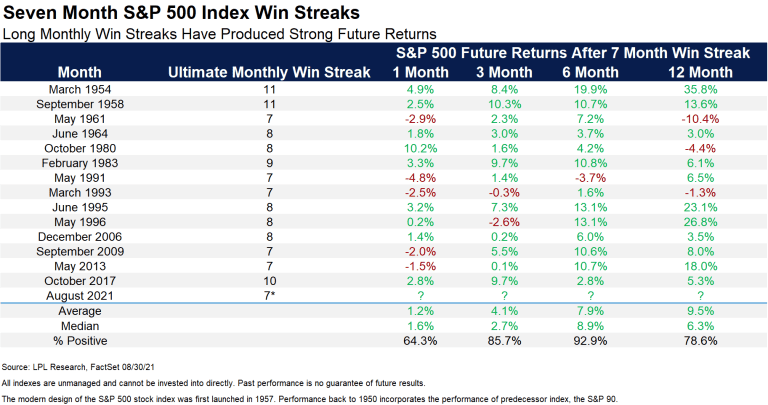
The S&P 500 also has a seven-month winning streak in 2021, a rare occurrence in the market and a bullish indicator for the next 12 months.
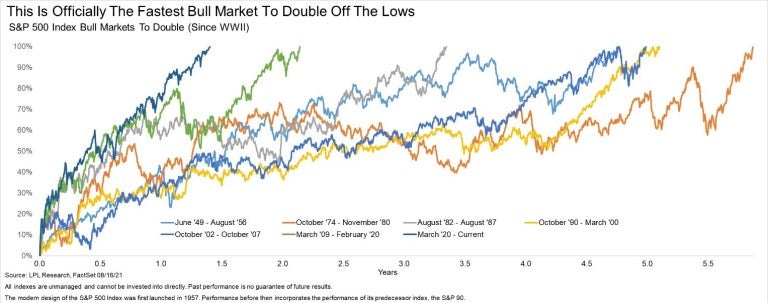
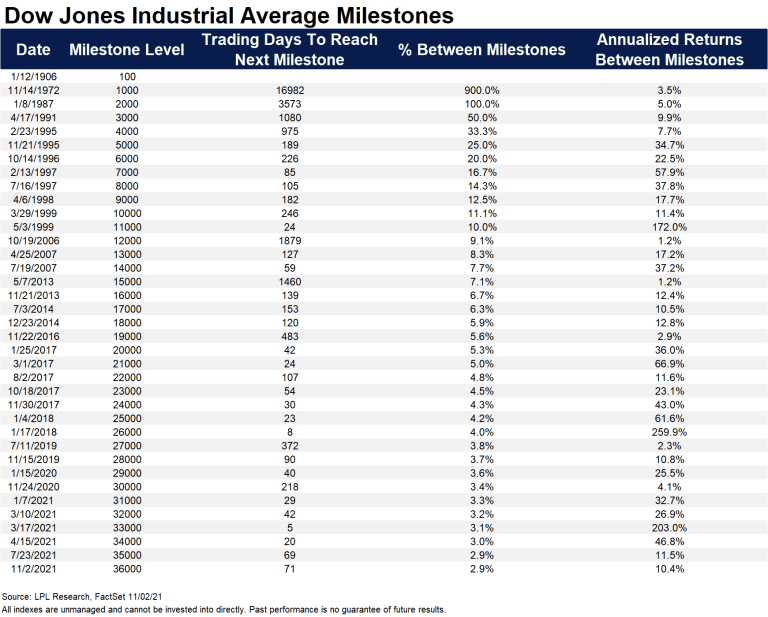
A number of S&P 500 and Dow Jones Industrial Average milestones came and went in 2021, including a record six new Dow 1,000-point milestones in one year.
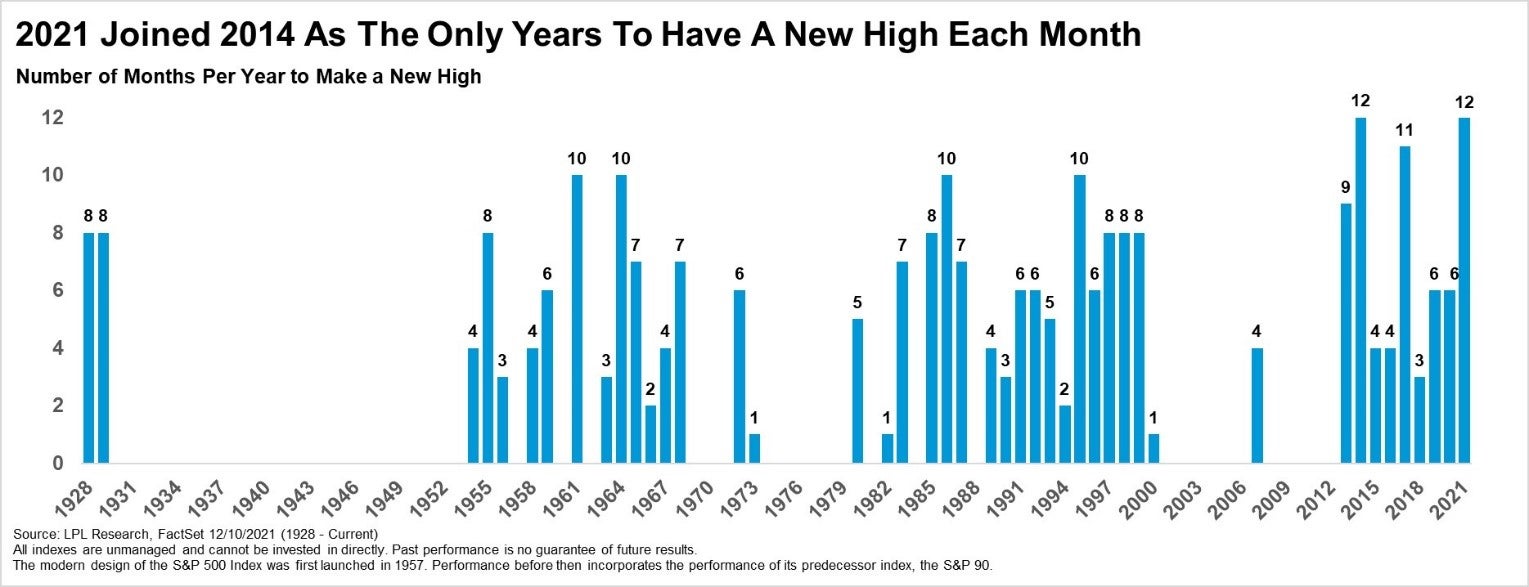
In fact, 2021 joined 2014 as the only year since 1928 in which the S&P 500 made new record highs in all 12 months of the year.
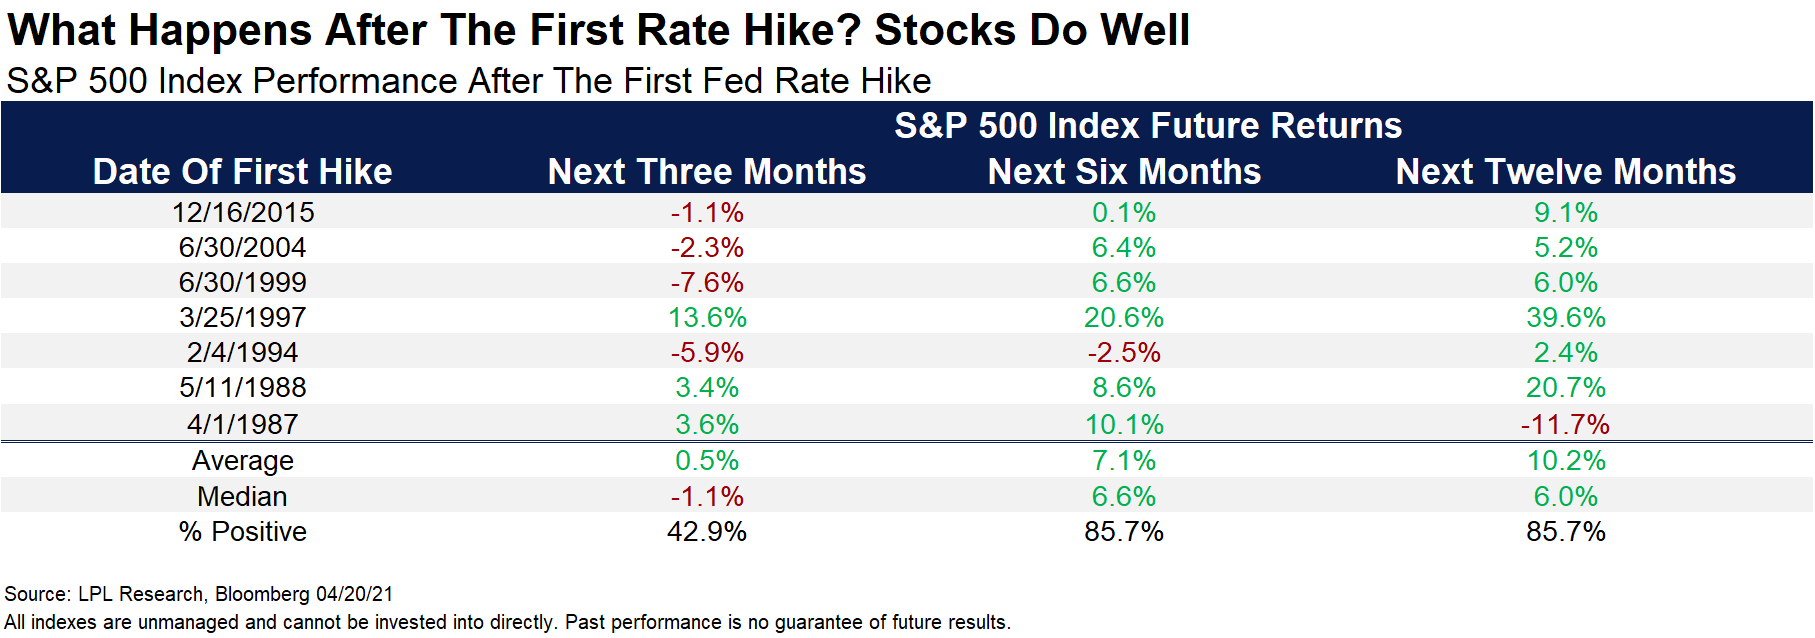
Heading into 2022, some investors are concerned that Federal Reserve interest rate hikes could stall the bull market. However, history suggests stocks actually perform relatively well in the first 12 months following the beginning of a Fed rate hike cycle.
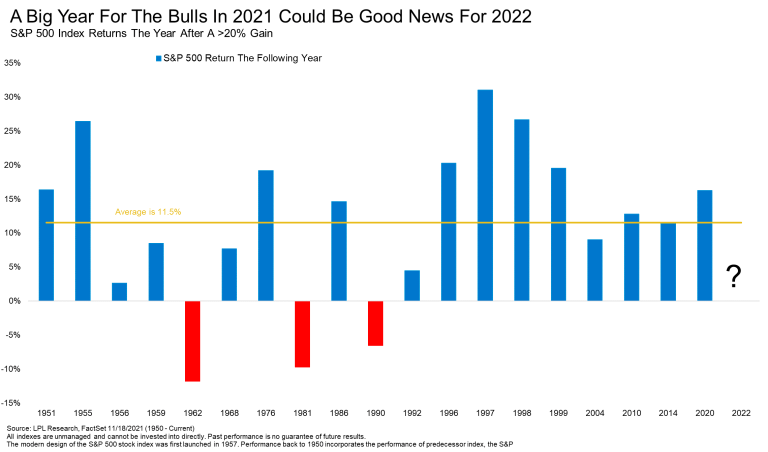
Finally, just because the market had a big year in 2021 doesn’t mean the upside is limited in 2022. In fact, the S&P 500 has historically traded higher in years following at least 20% gains.
精彩评论